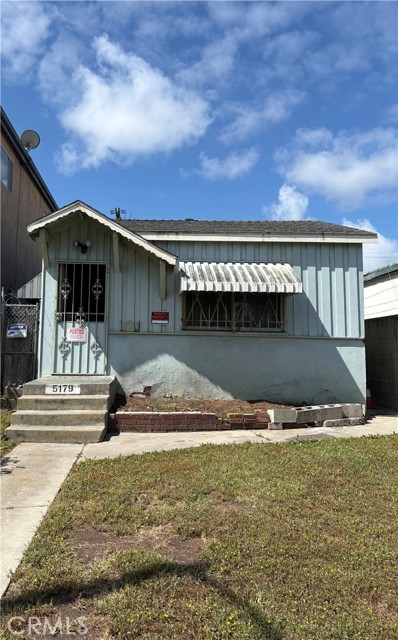
5179 Inglewood Blvd., Culver City, CA 90230
5179 Inglewood Blvd., Culver City, CA 90230
Property Description
Fixer with great floor plan, 2-bedroom and 1.5-bath features front and rear access is located in an area with strong Rental Demand driven by nearby technology companies. Perfect middle ground between Playa Vista, Marina Del Rey and Culver City located near Ballona Creek Bikeway to the beach. Buyers may explore the possibility of future development and building additional stories or ADUs, permitted by the City and local regulations. This central location provided easy access to major freeways and is just a short distance from the best restaurants, bars, shopping, and entertainment that downtown Culver City has to offer! An investor’s dreamed zoned R-3 lot opens the door to significant value-add strategies. Make your best offer!
Features & Amenities
Property Details
Mortgage Calculator
Current Rates
Comparative Market Analysis
Affordable Tier · 2 active · 5 closed
Culver City · Single Family Residence
Listed 5.2% below the median closed sale of $865,000.
Price Position
Priced below the market — value advantage over the field.
Active Properties (2)
Active Comparables
| Address | City | Year | BD | BTH | SqFt | LotSz | LP/SqFt | LP | DIM | Score |
|---|---|---|---|---|---|---|---|---|---|---|
| 11416 Venice Boulevard | Los Angeles | 1951 | 2 | 1 | 776 | 2,499 | $1,030 | $799,000 | 95 | 74 |
| 439 Hillsdale | Inglewood | 1940 | 2 | 1 | 1,039 | 5,426 | $885 | $920,000 | 22 | 57 |
| Total: 2 · Average | 2.0 | 1.0 | 907.5 | 3,962.5 | $957.5 | $859,500 | 58.5 | |||
| Median | 1,039 | $920,000 | ||||||||
Closed Properties (5)
Closed Comparables
| Address | City | Year | Date | BD | BTH | SqFt | LotSz | LP | SP | SP/SqFt | SP/LP | DIM | Score |
|---|---|---|---|---|---|---|---|---|---|---|---|---|---|
| 12019 Culver Drive | Culver City | 1960 | 11/14/2025 | 2 | 2 | 855 | 2,500 | $899,000 | $900,000 | $1,053 | 1.00 | 71 | 87 |
| 11945 Jefferson Blvd | Culver City | 1962 | 07/27/2026 | 2 | 1 | 904 | 2,412 | $829,900 | $795,000 | $879 | 0.96 | 144 | 85 |
| 4078 Alla Road | Los Angeles | 1952 | 12/01/2025 | 2 | 2 | 742 | 2,601 | $899,950 | $862,600 | $1,163 | 0.96 | 33 | 74 |
| 8843 De Haviland | Los Angeles | 1942 | 04/27/2026 | 2 | 1 | 1,106 | 5,002 | $925,000 | $880,000 | $796 | 0.95 | 108 | 58 |
| 5339 Thornburn Street | Los Angeles | 1949 | 06/30/2026 | 3 | 2 | 1,162 | 6,202 | $949,000 | $865,000 | $744 | 0.91 | 91 | 56 |
| Total: 5 · Average | 2.2 | 1.6 | 953.8 | 3,743.4 | $860,520 | $860,520 | $927 | — | 89.4 | ||||
| Median | 904 | $865,000 | $865,000 | ||||||||||
Market Analysis
List vs Sale $/SqFt
Sale Price Trend
Days on Market
Sale vs List Price
This analysis was generated automatically from MLS data. For an in-depth, human-reviewed valuation, contact Joseph Sardella at josephsardella@gmail.com.