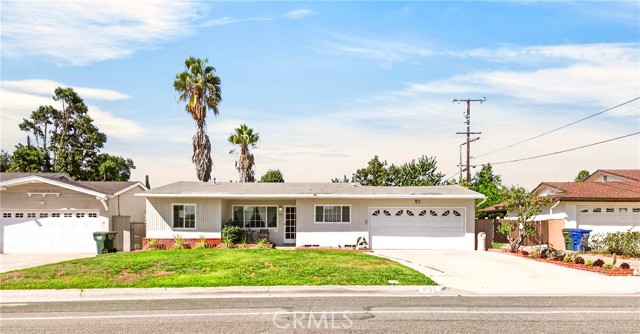
5155 North Arden, Temple City, CA 91780
5155 North Arden, Temple City, CA 91780
Property Description
Charming, move-in-ready home in a quiet Temple City neighborhood, offering approximately 1,480 sq. ft. with 3 bedrooms and 2 bathrooms. Features include beautiful hardwood floors, an original kitchen with granite countertops, and a spacious living room that flows into a generous family room addition. The private level backyard features mature fruit trees and a sparkling saltwater pool—perfect for relaxing or entertaining. Conveniently located just minutes from Live Oak Park. The approximately 308 sq. ft. enclosed patio was added by a previous owner without permits and may be eligible for permit reissuance. Buyers are advised to verify permitting status and eligibility directly with the City of Temple City.
Features & Amenities
Property Details
Mortgage Calculator
Current Rates
Comparative Market Analysis
Affordable Tier · 5 active · 5 closed
Temple City · Single Family Residence
Listed in line with the median closed sale of $999,000. Closed comps sold at 102% of list — strong seller's market.
Price Position
Aligned with the market — fair pricing for the comps.
Active Properties (5)
Active Comparables
| Address | City | Year | BD | BTH | SqFt | LotSz | LP/SqFt | LP | DIM | Score |
|---|---|---|---|---|---|---|---|---|---|---|
| 10762 Lynrose | Temple City | 1959 | 3 | 2 | 1,278 | 5,823 | $861 | $1.10M | 11 | 88 |
| 6111 Loma | Temple City | 1950 | 3 | 2 | 1,491 | 5,377 | $634 | $945,000 | 6 | 81 |
| 11233 Rockfield Drive | Arcadia | 1961 | 3 | 3 | 1,801 | 6,162 | $555 | $999,000 | 20 | 79 |
| 9033 Evansport | Rosemead | 1956 | 3 | 3 | 1,542 | 5,273 | $580 | $895,000 | 92 | 78 |
| 9255 Rio Dell | Rosemead | 1938 | 3 | 2 | 1,504 | 6,486 | $731 | $1.10M | 38 | 77 |
| Total: 5 · Average | 3.0 | 2.4 | 1,523.2 | 5,824.2 | $672.2 | $1.01M | 33.4 | |||
| Median | 1,504 | $999,000 | ||||||||
Closed Properties (5)
Closed Comparables
| Address | City | Year | Date | BD | BTH | SqFt | LotSz | LP | SP | SP/SqFt | SP/LP | DIM | Score |
|---|---|---|---|---|---|---|---|---|---|---|---|---|---|
| 5149 Arden Drive | Temple City | 1958 | 05/12/2026 | 3 | 2 | 1,476 | 5,769 | $849,999 | $930,000 | $630 | 1.09 | 35 | 94 |
| 10207 Green Street | Temple City | 1962 | 08/14/2026 | 3 | 2 | 1,391 | 6,621 | $999,000 | $999,000 | $718 | 1.00 | 36 | 92 |
| 10557 Olive Street | Temple City | 1966 | 09/16/2026 | 3 | 2 | 1,500 | 5,471 | $1.14M | $1.06M | $707 | 0.93 | 69 | 92 |
| 10631 Olive | Temple City | 1961 | 05/22/2026 | 3 | 2 | 1,152 | 6,743 | $899,000 | $942,000 | $818 | 1.05 | 31 | 83 |
| 5428 El Monte Avenue | Temple City | 1922 | 09/21/2026 | 3 | 2 | 1,504 | 7,549 | $998,000 | $1.03M | $685 | 1.03 | 34 | 83 |
| Total: 5 · Average | 3.0 | 2.0 | 1,404.6 | 6,430.6 | $992,200 | $992,200 | $711.6 | — | 41 | ||||
| Median | 1,476 | $999,000 | $999,000 | ||||||||||
Market Analysis
List vs Sale $/SqFt
Sale Price Trend
Days on Market
Sale vs List Price
This analysis was generated automatically from MLS data. For an in-depth, human-reviewed valuation, contact Joseph Sardella at josephsardella@gmail.com.