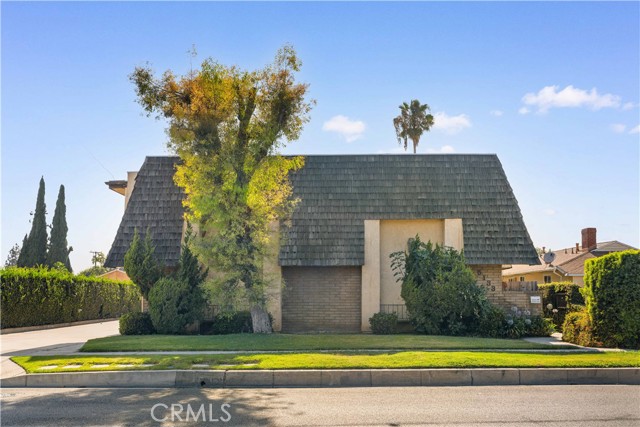
5133 Tyler, D, Temple City, CA 91780
5133 Tyler, D, Temple City, CA 91780
Property Description
Welcome to this freshly updated townhome in the highly desirable city of Temple City. Recently improved with brand-new interior paint and new laminate flooring throughout, this spacious residence offers 2 bedrooms, 2.5 bathrooms, and approximately 1,301 sq. ft. of comfortable living space. The inviting living room flows seamlessly into the dining area and kitchen, creating a bright and functional layout ideal for everyday living and entertaining. Upstairs, both bedrooms offer privacy and comfort, each with convenient access to its own bathroom, while the downstairs half bath is perfect for guests. Additional features include an attached 2-car garage with direct access, in-unit laundry, central heating and air conditioning, and a private patio for enjoying Southern California living. Conveniently located near shopping, dining, parks, schools, and major freeways, this home is a wonderful opportunity in one of the San Gabriel Valley’s most desirable communities.
Features & Amenities
Property Details
Mortgage Calculator
Current Rates
Comparative Market Analysis
Affordable Tier · 5 active · 5 closed
Temple City · Townhouse
Listed 4.6% below the median closed sale of $628,000. Closed comps sold at 101% of list — strong seller's market.
Price Position
Aligned with the market — fair pricing for the comps.
Active Properties (5)
Active Comparables
| Address | City | Year | BD | BTH | SqFt | LotSz | LP/SqFt | LP | DIM | Score |
|---|---|---|---|---|---|---|---|---|---|---|
| 5345 Peck Road | El Monte | 1980 | 3 | 3 | 1,564 | 106,057 | $422 | $659,999 | 187 | 76 |
| 11125 Legion | El Monte | 2018 | 2 | 3 | 1,328 | 8,540 | $443 | $588,000 | 9 | 74 |
| 3575 Whistler Ave | El Monte | 1985 | 3 | 3 | 1,226 | 40,221 | $424 | $520,000 | 101 | 71 |
| 3437 Cogswell Road | El Monte | 1994 | 3 | 3 | 1,420 | 1,325 | $477 | $678,000 | 58 | 67 |
| 1522 Encino | Monrovia | 1977 | 2 | 2 | 1,128 | 28,807 | $554 | $625,000 | 46 | 64 |
| Total: 5 · Average | 2.6 | 2.8 | 1,333.2 | 36,990 | $464 | $614,199.8 | 80.2 | |||
| Median | 1,328 | $625,000 | ||||||||
Closed Properties (5)
Closed Comparables
| Address | City | Year | Date | BD | BTH | SqFt | LotSz | LP | SP | SP/SqFt | SP/LP | DIM | Score |
|---|---|---|---|---|---|---|---|---|---|---|---|---|---|
| 11697 Ramona | El Monte | 1986 | 10/16/2026 | 2 | 3 | 1,527 | 1,463 | $599,900 | $595,000 | $390 | 0.99 | 84 | 77 |
| 10451 Mulhall Street | El Monte | 1981 | 12/08/2025 | 3 | 3 | 1,206 | 95,073 | $599,000 | $599,000 | $497 | 1.00 | 38 | 75 |
| 4612 Peck | El Monte | 2017 | 06/09/2026 | 3 | 3 | 1,379 | 45,054 | $599,000 | $640,000 | $464 | 1.07 | 103 | 72 |
| 3513 Wildwood | El Monte | 1988 | 07/27/2026 | 3 | 3 | 1,252 | 1,477 | $668,800 | $662,000 | $529 | 0.99 | 52 | 70 |
| 3628 Meadowlark | El Monte | 1988 | 07/23/2026 | 3 | 3 | 1,408 | 1,983 | $628,000 | $628,000 | $446 | 1.00 | 37 | 69 |
| Total: 5 · Average | 2.8 | 3.0 | 1,354.4 | 29,010 | $624,800 | $624,800 | $465.2 | — | 62.8 | ||||
| Median | 1,379 | $628,000 | $628,000 | ||||||||||
Market Analysis
List vs Sale $/SqFt
Sale Price Trend
Days on Market
Sale vs List Price
This analysis was generated automatically from MLS data. For an in-depth, human-reviewed valuation, contact Joseph Sardella at josephsardella@gmail.com.