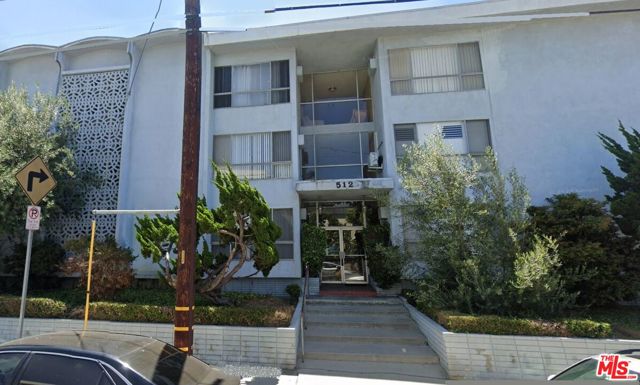
1 / 10
512 Evergreen Street, 309, Inglewood, CA 90302
$379K2bd · 2ba · 1,040 sqft
Lot 18,988 sqft•HOA $366/mo•Condominium•Active•214d on market•MLS# 00-26673259
512 Evergreen Street, 309, Inglewood, CA 90302
MLS# 00-26673259•Residential•Condominium
Active214 days on market
$379,000
2
Beds
2
Baths
1,040
Sq Ft
18,988
Lot Sq Ft
$366
HOA/mo
1966
Year Built
Property Description
Best buy in inglewood for a move in ready condo , Great top floor corner unit , oversized bedrooms , new flooring , a must see
Features & Amenities
FeeBuilt 1966
Property Details
Land Type
Fee
Year Built
1966
Property Type
Residential
Property Subtype
Condominium
Cooling
Wall/Window Unit(s)
City
Inglewood
Zip Code
90302
County
Los Angeles
Mortgage Calculator
Current Rates
$
$
%
Monthly Payment
$1,916.43
Principal & Interest
Loan Amount
$303,200
Total Interest
$386,715
Total Payment Over 30 Years
$689,915
This calculator provides estimates only. Actual mortgage payments may include taxes, insurance, HOA fees, and PMI. Contact a lender for accurate quotes.
Comparative Market Analysis
Affordable Tier · 5 active · 5 closed
512 Evergreen Street, 309, Inglewood, CA 90302
Inglewood · Condominium
$379K
Affordable TierBeds
2
Baths
2
Sqft
1,040
Lot
18,988 sqft
Year
1966
$/Sqft
$364
Pool: Yes✓
Spa: No✓
Listed 6.4% below the median closed sale of $405,000. Price per sqft ($364) is a 15% discount to closed comps ($426). Closed comps sold at 101% of list — strong seller's market. Expect a longer timeline — comps averaged 267 days on market.
Price Position
Priced below the market — value advantage over the field.
Price advantage
Subject listed at $379K· $364/sqft
Total list price
Closed comps
vs closed median $405K
−$26K (−6.4%)
Active comps
vs active median $400K
−$21K (−5.2%)
Price per sqft
Closed compsinsufficient comp data
Active comps
vs active avg $/sqft $503
−$139 (−27.6%)
Active Properties (5)
Active Comparables
| Address | City | Year | BD | BTH | SqFt | LotSz | LP/SqFt | LP | DIM | Score |
|---|---|---|---|---|---|---|---|---|---|---|
| 500 Evergreen | Inglewood | 1965 | 2 | 2 | 906 | 29,133 | $464 | $420,000 | 47 | 91 |
| 855 Victor Avenue | Inglewood | 1964 | 2 | 2 | 943 | 50,080 | $424 | $399,999 | 159 | 85 |
| 540 Evergreen Street | Inglewood | 1963 | 1 | 1 | 697 | 22,248 | $475 | $330,999 | 10 | 82 |
| 540 Evergreen Street | Inglewood | 1963 | 1 | 1 | 656 | 22,248 | $495 | $325,000 | 68 | 79 |
| 7100 La Tijera Boulevard | Los Angeles | 1991 | 1 | 1 | 664 | 23,918 | $655 | $435,000 | 137 | 68 |
| Total: 5 · Average | 1.4 | 1.4 | 773.2 | 29,525.4 | $502.6 | $382,199.6 | 84.2 | |||
| Median | 697 | $399,999 | ||||||||
Closed Properties (5)
Closed Comparables
| Address | City | Year | Date | BD | BTH | SqFt | LotSz | LP | SP | SP/SqFt | SP/LP | DIM | Score |
|---|---|---|---|---|---|---|---|---|---|---|---|---|---|
| 756 Inglewood Avenue | Inglewood | 1969 | 10/27/2026 | 2 | 2 | 976 | 24,982 | $400,000 | $400,000 | $410 | 1.00 | 97 | 92 |
| 913 Victor | Inglewood | 1964 | 09/25/2026 | 2 | 2 | 799 | 22,821 | $395,000 | $405,000 | $507 | 1.02 | 82 | 88 |
| 933 Cedar | Inglewood | 1973 | 04/24/2026 | 2 | 2 | 1,136 | 23,878 | $375,000 | $380,000 | $335 | 1.01 | 829 | 87 |
| 933 Cedar Street | Inglewood | 1973 | 02/04/2026 | 2 | 2 | 1,052 | 23,878 | $429,999 | $429,999 | $409 | 1.00 | 167 | 86 |
| 805 Glenway | Inglewood | 1964 | 07/14/2026 | 2 | 2 | 910 | 49,676 | $419,000 | $425,000 | $467 | 1.01 | 162 | 84 |
| Total: 5 · Average | 2.0 | 2.0 | 974.6 | 29,047 | $407,999.8 | $407,999.8 | $425.6 | — | 267.4 | ||||
| Median | 976 | $405,000 | $405,000 | ||||||||||
Market Analysis
List vs Sale $/SqFt
Sale Price Trend
Days on Market
Sale vs List Price
AI-generated CMA
This analysis was generated automatically from MLS data. For an in-depth, human-reviewed valuation, contact Joseph Sardella at josephsardella@gmail.com.