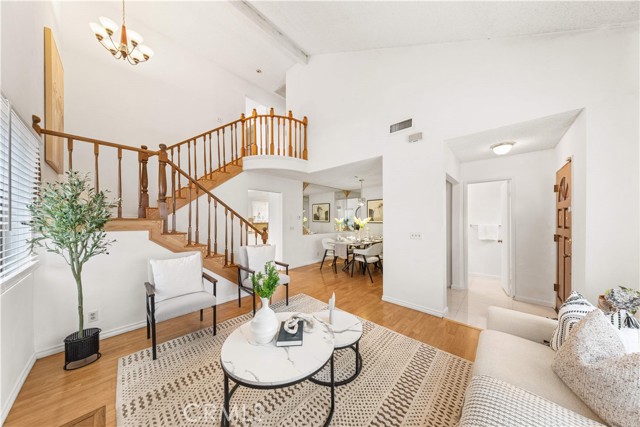
511 N McPherrin Ave, A, Monterey Park, CA 91754
511 N McPherrin Ave, A, Monterey Park, CA 91754
Property Description
Located in the heart of Monterey Park, this well-positioned two-story end-unit townhouse offers comfort, natural light, and everyday convenience. Featuring 3 bedrooms, 2.5 bathrooms, and approximately 1,561 sq. ft. of living space, the home showcases high ceilings and an open-concept layout that creates a bright and inviting atmosphere. The spacious living room and two separate dining areas provide flexible space for everyday living, entertaining, or a home office. The generously sized primary suite features a private balcony, while the front yard with mature fruit trees adds a charming outdoor touch. Conveniently located near highly-rated schools Mark Keppel High School, Garfield Medical Center, supermarkets, shopping, and a variety of dining options. An excellent opportunity for owner-occupants or buyers seeking a well-located property with versatile living space and convenient access to daily amenities. Don’t miss the opportunity to make this home your own!
Features & Amenities
Property Details
Mortgage Calculator
Current Rates
Comparative Market Analysis
Residential Tier · 5 active · 5 closed
Monterey Park · Condominium
Listed 5.5% above the median closed sale of $728,000. Closed comps sold at 100% of list — strong seller's market.
Price Position
Positioned above the market — commands a premium.
Active Properties (5)
Active Comparables
| Address | City | Year | BD | BTH | SqFt | LotSz | LP/SqFt | LP | DIM | Score |
|---|---|---|---|---|---|---|---|---|---|---|
| 130 Moore | Monterey Park | 1984 | 3 | 3 | 1,586 | 20,298 | $504 | $799,000 | 148 | 89 |
| 305 Lincoln Avenue | Monterey Park | 1986 | 4 | 3 | 1,560 | 34,389 | $492 | $768,000 | 132 | 85 |
| 317 Lincoln Street | Monterey Park | 1984 | 5 | 3 | 1,603 | 18,709 | $523 | $838,000 | 71 | 85 |
| 125 Chandler APT D | Monterey Park | 1982 | 3 | 3 | 1,365 | 10,434 | $549 | $749,000 | 81 | 81 |
| 120 Moore | Monterey Park | 2003 | 2 | 2 | 1,459 | 20,226 | $478 | $697,000 | 104 | 80 |
| Total: 5 · Average | 3.4 | 2.8 | 1,514.6 | 20,811.2 | $509.2 | $770,200 | 107.2 | |||
| Median | 1,560 | $768,000 | ||||||||
Closed Properties (5)
Closed Comparables
| Address | City | Year | Date | BD | BTH | SqFt | LotSz | LP | SP | SP/SqFt | SP/LP | DIM | Score |
|---|---|---|---|---|---|---|---|---|---|---|---|---|---|
| 480 Moore Avenue | Monterey Park | 1986 | 06/10/2026 | 3 | 3 | 1,656 | 27,163 | $688,000 | $728,000 | $440 | 1.06 | 42 | 86 |
| 203 Moore | Monterey Park | 1990 | 05/08/2026 | 4 | 3 | 1,616 | 10,037 | $800,000 | $780,000 | $483 | 0.97 | 67 | 85 |
| 215 Hilliard | Monterey Park | 1985 | 09/01/2026 | 3 | 3 | 1,334 | 11,278 | $698,000 | $685,000 | $513 | 0.98 | 39 | 85 |
| 516 Moore Avenue | Monterey Park | 1985 | 07/02/2026 | 4 | 3 | 1,407 | 11,480 | $688,000 | $700,000 | $498 | 1.02 | 36 | 82 |
| 480 North Moore Avenue | Monterey Park | 1986 | 07/31/2026 | 4 | 3 | 2,113 | 27,163 | $899,000 | $878,000 | $416 | 0.98 | 144 | 79 |
| Total: 5 · Average | 3.6 | 3.0 | 1,625.2 | 17,424.2 | $754,200 | $754,200 | $470 | — | 65.6 | ||||
| Median | 1,616 | $728,000 | $728,000 | ||||||||||
Market Analysis
List vs Sale $/SqFt
Sale Price Trend
Days on Market
Sale vs List Price
This analysis was generated automatically from MLS data. For an in-depth, human-reviewed valuation, contact Joseph Sardella at josephsardella@gmail.com.