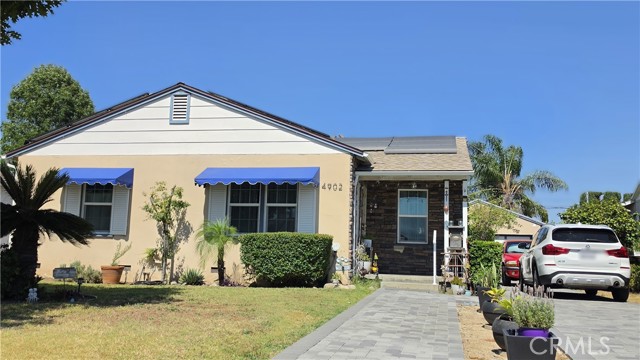
4902 Doreen, Temple City, CA 91780
4902 Doreen, Temple City, CA 91780
Property Description
HUGE PRICE REDUCTION! Don’t miss out on this amazing opportunity to make this spacious 4-bedroom, 2-bath home your own. Offering plenty of room for a large family, this property features a functional floor plan, generous living space, and a great-sized backyard perfect for entertaining, family gatherings, or simply relaxing outdoors. The roof is only 1 year old, providing added value and peace of mind. The property also includes a detached 2-car garage, offering plenty of parking, storage, or potential workspace. Come in and bring your personal touch to make this the home of your dreams. Whether you are a first-time buyer, growing family, or investor, this home has endless potential.
Features & Amenities
Property Details
Mortgage Calculator
Current Rates
Comparative Market Analysis
Residential Tier · 5 active · 5 closed
Temple City · Single Family Residence
Listed in line with the median closed sale of $1,200,000. Price per sqft ($601) is a 10% discount to closed comps ($671).
Price Position
Aligned with the market — fair pricing for the comps.
Active Properties (5)
Active Comparables
| Address | City | Year | BD | BTH | SqFt | LotSz | LP/SqFt | LP | DIM | Score |
|---|---|---|---|---|---|---|---|---|---|---|
| 4924 Birchland Place | Temple City | 1948 | 3 | 2 | 2,060 | 5,823 | $607 | $1.25M | 47 | 88 |
| 5113 Glickman Avenue | Temple City | 1960 | 4 | 3 | 1,752 | 6,695 | $678 | $1.19M | 40 | 87 |
| 11316 Miloann | Arcadia | 1950 | 5 | 3 | 1,664 | 7,906 | $624 | $1.04M | 43 | 82 |
| 10762 Lynrose | Temple City | 1959 | 3 | 2 | 1,278 | 5,823 | $861 | $1.10M | 11 | 78 |
| 9928 Howland | Temple City | 1930 | 3 | 2 | 1,618 | 14,235 | $833 | $1.35M | 13 | 77 |
| Total: 5 · Average | 3.6 | 2.4 | 1,674.4 | 8,096.4 | $720.6 | $1.18M | 30.8 | |||
| Median | 1,664 | $1.19M | ||||||||
Closed Properties (5)
Closed Comparables
| Address | City | Year | Date | BD | BTH | SqFt | LotSz | LP | SP | SP/SqFt | SP/LP | DIM | Score |
|---|---|---|---|---|---|---|---|---|---|---|---|---|---|
| 4928 El Monte | Temple City | 1947 | 04/30/2026 | 4 | 2 | 1,895 | 7,429 | $1.20M | $1.20M | $632 | 1.00 | 86 | 93 |
| 5156 Arden Drive | Temple City | 1951 | 02/25/2026 | 4 | 2 | 1,898 | 7,324 | $1.20M | $1.21M | $635 | 1.00 | 43 | 89 |
| 4836 Doreen | Temple City | 1947 | 10/09/2026 | 4 | 2 | 1,856 | 8,482 | $1.20M | $1.14M | $612 | 0.95 | 65 | 87 |
| 10418 Key West | Temple City | 1981 | 05/14/2026 | 4 | 2 | 1,675 | 7,280 | $1.29M | $1.30M | $776 | 1.01 | 16 | 86 |
| 5133 Pal Mal Avenue | Temple City | 1951 | 05/14/2026 | 3 | 2 | 1,711 | 12,939 | $1.25M | $1.20M | $701 | 0.96 | 72 | 84 |
| Total: 5 · Average | 3.8 | 2.0 | 1,807 | 8,690.8 | $1.21M | $1.21M | $671.2 | — | 56.4 | ||||
| Median | 1,856 | $1.20M | $1.20M | ||||||||||
Market Analysis
List vs Sale $/SqFt
Sale Price Trend
Days on Market
Sale vs List Price
This analysis was generated automatically from MLS data. For an in-depth, human-reviewed valuation, contact Joseph Sardella at josephsardella@gmail.com.