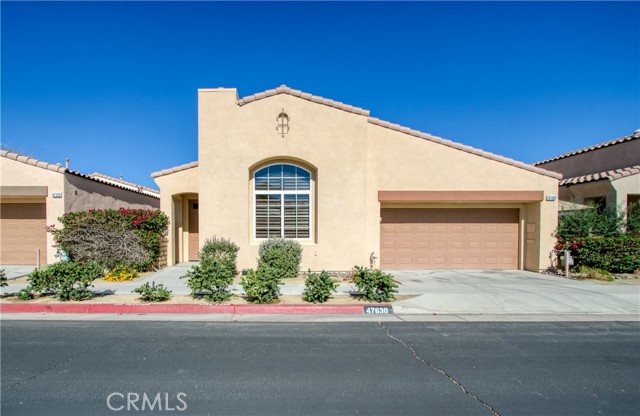
47630 Dancing Butterfly, La Quinta, CA 92253
47630 Dancing Butterfly, La Quinta, CA 92253
Property Description
Looking for a clean, affordable 55+ home in La Quinta! Look no further than this 2 bedroom, 2 bath home located in Watercolors, a community offering silent second mortgages through the La Quinta Housing Authority. This home is light and bright, with a large front window and high ceilings. The kitchen is open to the dining area as well as the family room and has tile countertops as well as a built in microwave, stove and dishwasher. At the rear of the home on opposite ends are the primary bedroom and secondary bedroom. Both are carpeted, with ceiling fans. Home has a nice sized fenced patio with a wrought-iron fence and slider into the home. As a moderate-income qualified property, this home has a $103,000 silent second to be assumed by the buyer. Must be a primary residence, financed (not a cash purchase). Guidelines for income are attached in the supplements tab.
Features & Amenities
Property Details
Mortgage Calculator
Current Rates
Comparative Market Analysis
Affordable Tier · 5 active · 5 closed
La Quinta · Single Family Residence
Listed 6.9% below the median closed sale of $375,000. Price per sqft ($284) is a 12% premium to closed comps ($254). Closed comps sold at 94% of list — buyers have negotiating leverage.
Price Position
Priced below the market — value advantage over the field.
Active Properties (5)
Active Comparables
| Address | City | Year | BD | BTH | SqFt | LotSz | LP/SqFt | LP | DIM | Score |
|---|---|---|---|---|---|---|---|---|---|---|
| 79355 Rose Dawn | La Quinta | 2006 | 2 | 2 | 1,231 | 3,049 | $280 | $345,000 | 85 | 97 |
| 47788 Dancing Butterfly | La Quinta | 2007 | 3 | 2 | 1,348 | 3,920 | $297 | $399,999 | 101 | 90 |
| 79337 Sign Of Spring Street | La Quinta | 2007 | 3 | 2 | 1,337 | 3,049 | $277 | $369,900 | 116 | 90 |
| 44077 Royal Troon Drive | Indio | 2002 | 2 | 2 | 1,420 | 4,792 | $218 | $309,999 | 13 | 75 |
| 80167 Royal Birkdale Drive | Indio | 2002 | 2 | 2 | 1,404 | 5,227 | $263 | $369,000 | 119 | 73 |
| Total: 5 · Average | 2.4 | 2.0 | 1,348 | 4,007.4 | $267 | $358,779.6 | 86.8 | |||
| Median | 1,348 | $369,000 | ||||||||
Closed Properties (5)
Closed Comparables
| Address | City | Year | Date | BD | BTH | SqFt | LotSz | LP | SP | SP/SqFt | SP/LP | DIM | Score |
|---|---|---|---|---|---|---|---|---|---|---|---|---|---|
| 47635 Soft Moonlight | La Quinta | 2007 | 01/21/2026 | 2 | 2 | 1,231 | 2,614 | $349,000 | $349,000 | $284 | 1.00 | 117 | 90 |
| 80167 Palm Circle Drive | La Quinta | 1973 | 08/21/2026 | 3 | 2 | 1,648 | 3,049 | $399,000 | $355,000 | $215 | 0.89 | 90 | 71 |
| 48608 Vista Tierra | La Quinta | 1994 | 02/24/2026 | 2 | 2 | 1,561 | 5,227 | $420,000 | $375,000 | $240 | 0.89 | 48 | 70 |
| 44648 Heritage Palms Drive | Indio | 1999 | 04/10/2026 | 2 | 2 | 1,382 | 4,786 | $399,000 | $389,000 | $281 | 0.97 | 58 | 70 |
| 80187 Royal Birkdale Drive | Indio | 1999 | 04/22/2026 | 2 | 2 | 1,553 | 6,098 | $399,000 | $385,000 | $248 | 0.96 | 172 | 68 |
| Total: 5 · Average | 2.2 | 2.0 | 1,475 | 4,354.8 | $370,600 | $370,600 | $253.6 | — | 97 | ||||
| Median | 1,553 | $375,000 | $375,000 | ||||||||||
Market Analysis
List vs Sale $/SqFt
Sale Price Trend
Days on Market
Sale vs List Price
This analysis was generated automatically from MLS data. For an in-depth, human-reviewed valuation, contact Joseph Sardella at josephsardella@gmail.com.