1 / 1
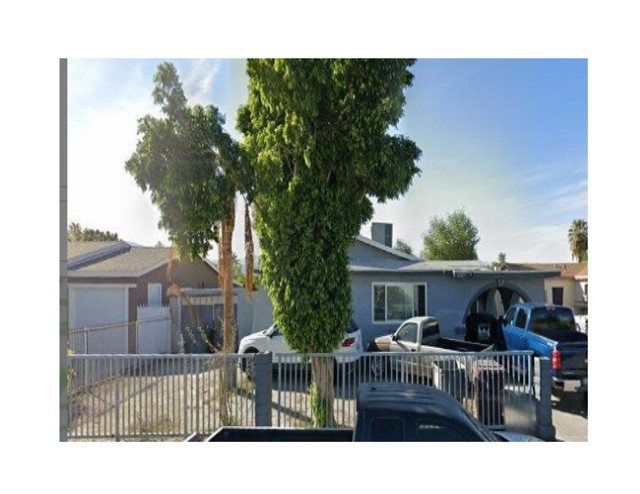
47267 Blue Jay Street, Indio, CA 92201
$265K3bd · 2ba · 1,080 sqft
Lot 6,534 sqft•Single Family Residence•Active•14d on market•MLS# SB-26226694
47267 Blue Jay Street, Indio, CA 92201
MLS# SB-26226694•Residential•Single Family Residence
Active14 days on market
$265,000
3
Beds
2
Baths
1,080
Sq Ft
6,534
Lot Sq Ft
1972
Year Built
Property Description
Great FIXER - Bring Your Hammer and Tools - Great Owner Contractor Prperty - Nice up and Coming Area - Good Bones - Basic Cosmetic and Upgrade Needed and you have a Fantastic home Built In 1972 at A Discount Accordingly ! Better Hurry We Already Have 2 offers !
Features & Amenities
FeeBuilt 1972
Property Details
Land Type
Fee
Year Built
1972
Property Type
Residential
Property Subtype
Single Family Residence
Parking Spaces
2
Garage Spaces
2
Heating
Central
Cooling
Central Air
City
Indio
Zip Code
92201
County
Riverside
Mortgage Calculator
Current Rates
$
$
%
Monthly Payment
$1,339.98
Principal & Interest
Loan Amount
$212,000
Total Interest
$270,394
Total Payment Over 30 Years
$482,394
This calculator provides estimates only. Actual mortgage payments may include taxes, insurance, HOA fees, and PMI. Contact a lender for accurate quotes.
Comparative Market Analysis
Affordable Tier · 2 active · 5 closed
47267 Blue Jay Street, Indio, CA 92201
Indio · Single Family Residence
$265K
Affordable TierBeds
3
Baths
2
Sqft
1,080
Lot
6,534 sqft
Year
1972
$/Sqft
$245
Pool: No✓
Garage: 2-car✓
Listed in line with the median closed sale of $260,000. Expect a longer timeline — comps averaged 122 days on market.
Price Position
Aligned with the market — fair pricing for the comps.
At market
Subject listed at $265K· $245/sqft
Total list price
Closed comps
vs closed median $260K
+$5K (+1.9%)
Active comps
vs active median $275K
−$10K (−3.6%)
Price per sqft
Closed compsinsufficient comp data
Active comps
vs active avg $/sqft $147
+$98 (+66.7%)
Active Properties (2)
Active Comparables
| Address | City | Year | BD | BTH | SqFt | LotSz | LP/SqFt | LP | DIM | Score |
|---|---|---|---|---|---|---|---|---|---|---|
| 50041 Balboa | Coachella | 1967 | 3 | 2 | 1,758 | 6,970 | $156 | $275,000 | 63 | 65 |
| 82300 Garden Avenue | Indio | 1970 | 6 | 2 | 1,990 | 7,405 | $138 | $275,000 | 20 | 54 |
| Total: 2 · Average | 4.5 | 2.0 | 1,874 | 7,187.5 | $147 | $275,000 | 41.5 | |||
| Median | 1,990 | $275,000 | ||||||||
Closed Properties (5)
Closed Comparables
| Address | City | Year | Date | BD | BTH | SqFt | LotSz | LP | SP | SP/SqFt | SP/LP | DIM | Score |
|---|---|---|---|---|---|---|---|---|---|---|---|---|---|
| 83539 Canary Ct | Indio | 1972 | 11/07/2025 | 3 | 2 | 1,120 | 6,534 | $275,000 | $260,000 | $232 | 0.94 | 52 | 89 |
| 83685 Hopi Avenue | Indio | 1975 | 11/19/2025 | 3 | 2 | 1,236 | 6,534 | $299,000 | $299,000 | $242 | 1.00 | 35 | 72 |
| 81461 Avenue 48 | Indio | 1981 | 11/10/2025 | 2 | 2 | 1,210 | 3,920 | $310,000 | $300,000 | $248 | 0.97 | 118 | 69 |
| 82625 Requa Avenue | Indio | 1952 | 07/06/2026 | 2 | 2 | 1,549 | 7,405 | $230,000 | $252,200 | $163 | 1.10 | 145 | 66 |
| 84590 Vera Cruz | Coachella | 1980 | 12/04/2025 | 2 | 1 | 954 | 4,356 | $265,000 | $255,500 | $268 | 0.96 | 262 | 66 |
| Total: 5 · Average | 2.4 | 1.8 | 1,213.8 | 5,749.8 | $273,340 | $273,340 | $230.6 | — | 122.4 | ||||
| Median | 1,210 | $260,000 | $260,000 | ||||||||||
Market Analysis
List vs Sale $/SqFt
Sale Price Trend
Days on Market
Sale vs List Price
AI-generated CMA
This analysis was generated automatically from MLS data. For an in-depth, human-reviewed valuation, contact Joseph Sardella at josephsardella@gmail.com.