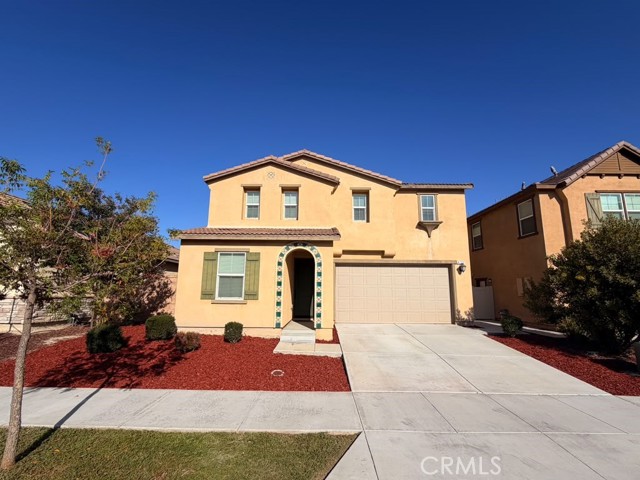
1 / 22
4723 South Rogers, Ontario, CA 91762
$755K4bd · 3ba · 2,403 sqft
Lot 4,500 sqft•HOA $106/mo•Single Family Residence•Active•40d on market•MLS# IV-26208094
4723 South Rogers, Ontario, CA 91762
MLS# IV-26208094•Residential•Single Family Residence
Active40 days on market
$755,000
4
Beds
3
Baths
2,403
Sq Ft
4,500
Lot Sq Ft
$106
HOA/mo
2019
Year Built
None
View
Property Description
Beautiful 4-bedroom, 3-bathroom. This home offers a spacious open floor plan with a bedroom and full bathroom downstairs, making it ideal for guests or extended family. Features include a large kitchen with stainless steel appliances, indoor laundry, 2-car garage, and a private backyard.
Features & Amenities
FeeBuilt 2019
Property Details
Land Type
Fee
Year Built
2019
Property Type
Residential
Property Subtype
Single Family Residence
Parking Spaces
2
Garage Spaces
2
Heating
Central
Cooling
Central Air
View
None
Flooring
Vinyl, Carpet
City
Ontario
Zip Code
91762
County
San Bernardino
Mortgage Calculator
Current Rates
$
$
%
Monthly Payment
$3,817.69
Principal & Interest
Loan Amount
$604,000
Total Interest
$770,369
Total Payment Over 30 Years
$1,374,369
This calculator provides estimates only. Actual mortgage payments may include taxes, insurance, HOA fees, and PMI. Contact a lender for accurate quotes.
Comparative Market Analysis
Residential Tier · 5 active · 5 closed
4723 South Rogers, Ontario, CA 91762
Ontario · Single Family Residence
$755K
Residential TierBeds
4
Baths
3
Sqft
2,403
Lot
4,500 sqft
Year
2019
$/Sqft
$314
Pool: No✓
Spa: No✓
View: None✓
Garage: 2-car✓
Listed 10.7% below the median closed sale of $845,000.
Price Position
Priced below the market — value advantage over the field.
Price advantage
Subject listed at $755K· $314/sqft
Total list price
Closed comps
vs closed median $845K
−$90K (−10.7%)
Active comps
vs active median $792K
−$37K (−4.7%)
Price per sqft
Closed compsinsufficient comp data
Active comps
vs active avg $/sqft $326
−$12 (−3.6%)
Active Properties (5)
Active Comparables
| Address | City | Year | BD | BTH | SqFt | LotSz | LP/SqFt | LP | DIM | Score |
|---|---|---|---|---|---|---|---|---|---|---|
| 4847 Rosemary | Ontario | 2018 | 4 | 3 | 2,718 | 4,710 | $313 | $850,000 | 37 | 95 |
| 3080 Sussex Privado | Ontario | 2019 | 4 | 3 | 2,280 | 3,184 | $331 | $755,000 | 39 | 94 |
| 5092 Heritage Paseo | Ontario | 2016 | 4 | 3 | 2,336 | 3,881 | $329 | $768,800 | 2 | 94 |
| 5087 Centennial | Ontario | 2015 | 4 | 3 | 2,414 | 3,954 | $339 | $818,500 | 27 | 93 |
| 2782 Thompson | Ontario | 2017 | 4 | 3 | 2,504 | 4,767 | $316 | $792,000 | 9 | 92 |
| Total: 5 · Average | 4.0 | 3.0 | 2,450.4 | 4,099.2 | $325.6 | $796,860 | 22.8 | |||
| Median | 2,414 | $792,000 | ||||||||
Closed Properties (5)
Closed Comparables
| Address | City | Year | Date | BD | BTH | SqFt | LotSz | LP | SP | SP/SqFt | SP/LP | DIM | Score |
|---|---|---|---|---|---|---|---|---|---|---|---|---|---|
| 4844 Ophelia Lane | Ontario | 2019 | 06/04/2026 | 4 | 3 | 2,389 | 4,472 | $798,888 | $830,000 | $347 | 1.04 | 51 | 95 |
| 4883 Bountiful | Ontario | 2018 | 10/05/2026 | 4 | 3 | 2,718 | 4,325 | $868,000 | $853,000 | $314 | 0.98 | 40 | 94 |
| 2834 Murdock | Ontario | 2019 | 10/19/2026 | 5 | 3 | 2,742 | 4,590 | $870,000 | $863,000 | $315 | 0.99 | 103 | 93 |
| 2583 Hazel Street | Ontario | 2021 | 08/21/2026 | 4 | 3 | 2,451 | 4,050 | $859,000 | $845,000 | $345 | 0.98 | 56 | 93 |
| 4967 Tangerine | Ontario | 2018 | 08/05/2026 | 4 | 3 | 2,214 | 3,765 | $759,000 | $755,000 | $341 | 0.99 | 42 | 93 |
| Total: 5 · Average | 4.2 | 3.0 | 2,502.8 | 4,240.4 | $829,200 | $829,200 | $332.4 | — | 58.4 | ||||
| Median | 2,451 | $845,000 | $845,000 | ||||||||||
Market Analysis
List vs Sale $/SqFt
Sale Price Trend
Days on Market
Sale vs List Price
AI-generated CMA
This analysis was generated automatically from MLS data. For an in-depth, human-reviewed valuation, contact Joseph Sardella at josephsardella@gmail.com.