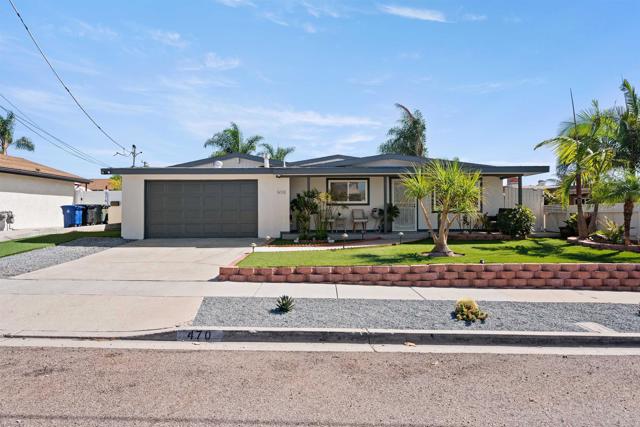
470 Jamul Ct, Chula Vista, CA 91911
470 Jamul Ct, Chula Vista, CA 91911
Property Description
PRICED TO SELL!!! Beautifully upgraded home —Ready for a new family!!! Bright and airy with abundant natural light and skylights. Four spacious bedrooms and three full baths. Great functional kitchen with new appliances. Interior & exterior freshly painted. Sparkling above ground pool and spa. This home is perfect for entertaining! Enjoy the fruit trees and avocado trees from your own backyard. This home offers a two-car garage and enough parking for RV. Close to shopping and schools. Minutes from freeway and Downtown San Diego. A Must See!!!
Features & Amenities
Property Details
Mortgage Calculator
Current Rates
Comparative Market Analysis
Residential Tier · 5 active · 5 closed
Chula Vista · Single Family Residence
Listed 4.4% above the median closed sale of $814,500. Price per sqft ($475) is a 25% discount to closed comps ($637). Closed comps sold at 102% of list — strong seller's market.
Price Position
Aligned with the market — fair pricing for the comps.
Active Properties (5)
Active Comparables
| Address | City | Year | BD | BTH | SqFt | LotSz | LP/SqFt | LP | DIM | Score |
|---|---|---|---|---|---|---|---|---|---|---|
| 962 Nacion Ave. | Chula Vista | 1964 | 3 | 2 | 1,670 | 7,800 | $562 | $939,000 | 11 | 81 |
| 819 Arroyo Place | Chula Vista | 1977 | 3 | 2 | 1,540 | 7,405 | $584 | $899,999 | 4 | 73 |
| 63 L | Chula Vista | 1952 | 3 | 2 | 1,702 | 7,100 | $432 | $735,000 | 14 | 66 |
| 1562 Oleander Avenue | Chula Vista | 1967 | 4 | 2 | 1,248 | 10,000 | $720 | $899,000 | 24 | 66 |
| 977 Cuyamaca Avenue | Chula Vista | 1955 | 3 | 2 | 1,274 | 8,600 | $588 | $749,000 | 3 | 64 |
| Total: 5 · Average | 3.2 | 2.0 | 1,486.8 | 8,181 | $577.2 | $844,399.8 | 11.2 | |||
| Median | 1,540 | $899,000 | ||||||||
Closed Properties (5)
Closed Comparables
| Address | City | Year | Date | BD | BTH | SqFt | LotSz | LP | SP | SP/SqFt | SP/LP | DIM | Score |
|---|---|---|---|---|---|---|---|---|---|---|---|---|---|
| 1228 Oleander | Chula Vista | 1971 | 05/13/2026 | 4 | 2 | 1,316 | 7,000 | $800,000 | $800,000 | $608 | 1.00 | 34 | 76 |
| 466 Thrush Street | Chula Vista | 1971 | 04/20/2026 | 4 | 3 | 1,204 | 6,900 | $891,000 | $891,000 | $740 | 1.00 | 58 | 75 |
| 444 Oxford Street | Chula Vista | 1961 | 07/23/2026 | 3 | 2 | 1,032 | 6,970 | $699,900 | $732,000 | $709 | 1.05 | 42 | 74 |
| 491 Nanette Street | Chula Vista | 1961 | 11/12/2025 | 3 | 2 | 1,580 | 7,400 | $849,999 | $865,000 | $547 | 1.02 | 81 | 71 |
| 310 Moss Street | Chula Vista | 1961 | 06/26/2026 | 3 | 2 | 1,407 | 6,970 | $800,000 | $814,500 | $579 | 1.02 | 38 | 70 |
| Total: 5 · Average | 3.4 | 2.2 | 1,307.8 | 7,048 | $820,500 | $820,500 | $636.6 | — | 50.6 | ||||
| Median | 1,316 | $814,500 | $814,500 | ||||||||||
Market Analysis
List vs Sale $/SqFt
Sale Price Trend
Days on Market
Sale vs List Price
This analysis was generated automatically from MLS data. For an in-depth, human-reviewed valuation, contact Joseph Sardella at josephsardella@gmail.com.