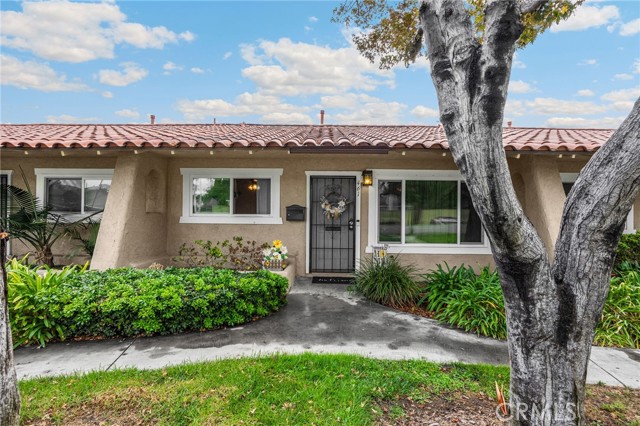
461 Via De Leon, Placentia, CA 92870
461 Via De Leon, Placentia, CA 92870
Property Description
Discover comfort and style in this beautifully upgraded 2-bedroom, 1-bath townhome offering 962 square feet of living space. The inviting open-concept kitchen features semi-custom soft-close cabinetry, quartz countertops, and stainless steel appliances, creating an ideal space for everyday living and entertaining. The updated bathroom offers semi-custom cabinetry, solid-surface countertops, and a walk-in shower. Additional upgrades include triple-pane windows, newer HVAC, new water heater, ceiling fans throughout, and newer washer and dryer. The 2-car garage features a utility sink and additional refrigerator. Modern finishes, thoughtful upgrades, and functional living all in one!
Features & Amenities
Property Details
Mortgage Calculator
Current Rates
Comparative Market Analysis
Affordable Tier · 5 active · 5 closed
Placentia · Single Family Residence
Listed in line with the median closed sale of $640,000. Closed comps sold at 101% of list — strong seller's market.
Price Position
Aligned with the market — fair pricing for the comps.
Active Properties (5)
Active Comparables
| Address | City | Year | BD | BTH | SqFt | LotSz | LP/SqFt | LP | DIM | Score |
|---|---|---|---|---|---|---|---|---|---|---|
| 457 Via De Leon | Placentia | 1972 | 2 | 1 | 950 | 1,805 | $673 | $639,000 | 24 | 96 |
| 1867 Belmont Court | Placentia | 1980 | 2 | 2 | 968 | 2,576 | $749 | $725,000 | 37 | 71 |
| 4524 Jamestown | Yorba Linda | 1965 | 3 | 2 | 1,190 | 822 | $622 | $739,999 | 107 | 67 |
| 1664 Oak | Placentia | 1945 | 2 | 1 | 749 | 4,030 | $968 | $725,000 | 129 | 57 |
| 313 Belmont Lane | Placentia | 1980 | 3 | 3 | 1,360 | 2,116 | $514 | $699,000 | 79 | 57 |
| Total: 5 · Average | 2.4 | 1.8 | 1,043.4 | 2,269.8 | $705.2 | $705,599.8 | 75.2 | |||
| Median | 968 | $725,000 | ||||||||
Closed Properties (5)
Closed Comparables
| Address | City | Year | Date | BD | BTH | SqFt | LotSz | LP | SP | SP/SqFt | SP/LP | DIM | Score |
|---|---|---|---|---|---|---|---|---|---|---|---|---|---|
| 621 Seneca | Placentia | 1971 | 06/05/2026 | 2 | 1 | 816 | 1,732 | $635,000 | $640,000 | $784 | 1.01 | 44 | 83 |
| 793 Ottawa | Placentia | 1972 | 08/20/2026 | 2 | 2 | 928 | 1,294 | $625,000 | $628,000 | $677 | 1.00 | 41 | 82 |
| 261 Chinook | Placentia | 1975 | 08/05/2026 | 2 | 2 | 1,064 | 1,632 | $710,000 | $735,000 | $691 | 1.03 | 27 | 81 |
| 2318 Blackfoot Avenue | Placentia | 1971 | 11/07/2025 | 2 | 1 | 816 | 1,732 | $599,000 | $595,000 | $729 | 0.99 | 71 | 78 |
| 2319 Cayuga Avenue | Placentia | 1972 | 10/01/2026 | 3 | 2 | 1,121 | 1,453 | $685,000 | $685,000 | $611 | 1.00 | 1 | 78 |
| Total: 5 · Average | 2.2 | 1.6 | 949 | 1,568.6 | $656,600 | $656,600 | $698.4 | — | 36.8 | ||||
| Median | 928 | $640,000 | $640,000 | ||||||||||
Market Analysis
List vs Sale $/SqFt
Sale Price Trend
Days on Market
Sale vs List Price
This analysis was generated automatically from MLS data. For an in-depth, human-reviewed valuation, contact Joseph Sardella at josephsardella@gmail.com.