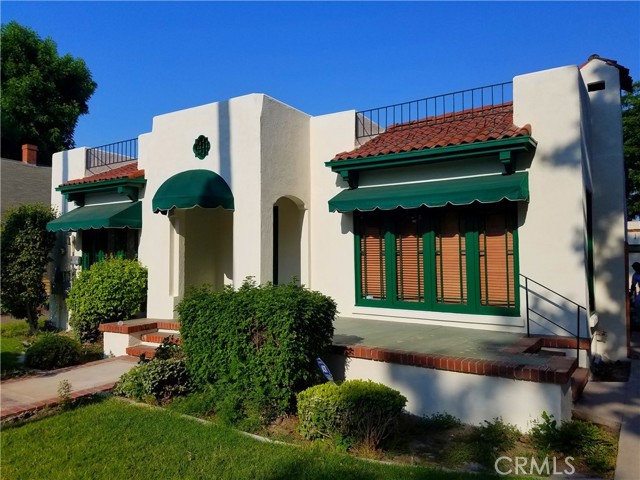
454 South Glassell, Orange, CA 92866
454 South Glassell, Orange, CA 92866
Property Description
Positioned in one of Orange County's strongest rental submarkets, this income-producing property presents a rare opportunity to acquire a large bedroom-count home with immediate cash flow and significant long-term upside. Located just minutes from Chapman University, Historic Old Towne Orange, CHOC Children's Hospital, St. Joseph Hospital, shopping, restaurants, and major freeway access, the property benefits from a consistently strong tenant pool driven by students, medical professionals, and young professionals seeking housing in one of Orange County's most desirable communities. Built in 1922, the residence offers approximately 2,668 square feet above grade (basement not included) on a 7,263 square foot lot. The well-designed floor plan features seven bedrooms and four bathrooms, including one private ensuite bedroom, two spacious living rooms, and one shared kitchen. Six bedrooms share three bathrooms, thoughtfully configured with two bedrooms per bathroom. The basement includes the washer and dryer, central HVAC system, furnace, and water heater, maximizing the functionality of the primary living space. For investors, this property offers compelling value-add potential. Current occupancy leaves an immediate opportunity to increase income. Additionally, existing rents appear below prevailing market rates for comparable private-bedroom rentals near Chapman University, creating further upside through strategic lease renewals and professional management. The surrounding neighborhood has demonstrated strong long-term appreciation, supported by Chapman University's continued expansion, ongoing investment in Historic Old Towne Orange, proximity to world-class healthcare employers, and limited inventory of large homes suitable for student and shared housing. These market fundamentals have consistently driven both rental demand and property values, making this an attractive acquisition for investors seeking stable cash flow with meaningful appreciation potential.
Features & Amenities
Property Details
Mortgage Calculator
Current Rates
Comparative Market Analysis
Luxury Tier · 5 active · 5 closed
Orange · Single Family Residence
Listed 5.5% above the median closed sale of $1,600,000. Price per sqft ($633) is a 29% discount to closed comps ($892). Expect a longer timeline — comps averaged 171 days on market. Luxury tier — fewer comparable sales widen the confidence range.
Price Position
Positioned above the market — commands a premium.
Active Properties (5)
Active Comparables
| Address | City | Year | BD | BTH | SqFt | LotSz | LP/SqFt | LP | DIM | Score |
|---|---|---|---|---|---|---|---|---|---|---|
| 1324 Chapman | Orange | 1926 | 2 | 2 | 2,163 | 6,534 | $693 | $1.50M | 124 | 72 |
| 2429 Heliotrope | Santa Ana | 1930 | 3 | 2 | 1,832 | 7,800 | $901 | $1.65M | 24 | 70 |
| 390 Milford Road | Orange | 1960 | 5 | 4 | 3,387 | 7,200 | $443 | $1.50M | 31 | 69 |
| 365 Magnolia | Orange | 1986 | 7 | 5 | 3,900 | 7,954 | $486 | $1.90M | 269 | 69 |
| 2116 Freeman | Santa Ana | 1959 | 4 | 2 | 2,396 | 7,938 | $626 | $1.50M | 102 | 66 |
| Total: 5 · Average | 4.2 | 3.0 | 2,735.6 | 7,485.2 | $629.8 | $1.61M | 110 | |||
| Median | 2,396 | $1.50M | ||||||||
Closed Properties (5)
Closed Comparables
| Address | City | Year | Date | BD | BTH | SqFt | LotSz | LP | SP | SP/SqFt | SP/LP | DIM | Score |
|---|---|---|---|---|---|---|---|---|---|---|---|---|---|
| 130 Lime Street | Orange | 2021 | 06/01/2026 | 6 | 3 | 2,105 | 6,360 | $1.70M | $1.70M | $808 | 1.00 | 67 | 79 |
| 173 Cypress | Orange | 1916 | 10/23/2026 | 3 | 2 | 1,436 | 7,841 | $1.63M | $1.61M | $1,121 | 0.99 | 37 | 77 |
| 280 Cleveland Street | Orange | 1914 | 01/05/2026 | 4 | 2 | 1,675 | 7,101 | $1.50M | $1.48M | $881 | 0.99 | 575 | 73 |
| 2850 Stone Pine | Santa Ana | 2006 | 06/30/2026 | 4 | 4 | 3,464 | 6,863 | $1.68M | $1.60M | $462 | 0.95 | 119 | 72 |
| 313 Palmyra | Orange | 1908 | 11/18/2025 | 3 | 2 | 1,228 | 6,000 | $1.45M | $1.46M | $1,189 | 1.01 | 56 | 71 |
| Total: 5 · Average | 4.0 | 2.6 | 1,981.6 | 6,833 | $1.57M | $1.57M | $892.2 | — | 170.8 | ||||
| Median | 1,675 | $1.60M | $1.60M | ||||||||||
Market Analysis
List vs Sale $/SqFt
Sale Price Trend
Days on Market
Sale vs List Price
This analysis was generated automatically from MLS data. For an in-depth, human-reviewed valuation, contact Joseph Sardella at josephsardella@gmail.com.