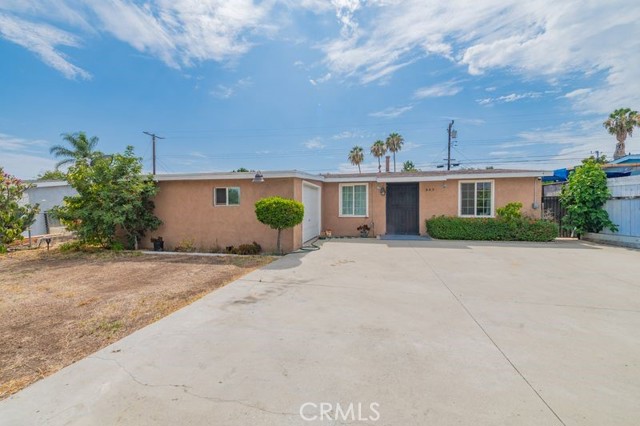
443 North Begonia, Ontario, CA 91762
443 North Begonia, Ontario, CA 91762
Property Description
This house is situated in a prime location in Ontario and features 3 bedrooms and 1.75 bathrooms. It is a comfortable single-story home, and a permit for a 499-square-foot expansion has already been obtained. This offers buyers significant room for expansion, making it an excellent choice for either personal residence or investment. The property also includes a spacious backyard, providing ample space for outdoor entertaining, gardening, or future improvements. Conveniently located near schools, shopping centers, restaurants, parks, and major freeways, it offers both comfort and convenience. With its great location and strong potential, this home is a fantastic opportunity for homeowners and investors alike.
Features & Amenities
Property Details
Mortgage Calculator
Current Rates
Comparative Market Analysis
Affordable Tier · 5 active · 5 closed
Ontario · Single Family Residence
Listed 6.8% below the median closed sale of $675,000.
Price Position
Priced below the market — value advantage over the field.
Active Properties (5)
Active Comparables
| Address | City | Year | BD | BTH | SqFt | LotSz | LP/SqFt | LP | DIM | Score |
|---|---|---|---|---|---|---|---|---|---|---|
| 509 Camellia Avenue | Ontario | 1954 | 3 | 2 | 1,000 | 6,758 | $670 | $669,990 | 5 | 96 |
| 1234 Vesta Street | Ontario | 1956 | 3 | 2 | 1,312 | 7,474 | $518 | $680,000 | 24 | 88 |
| 10033 Del Mar Avenue | Montclair | 1952 | 3 | 2 | 876 | 8,246 | $785 | $688,000 | 17 | 87 |
| 829 Berkeley Court | Ontario | 1947 | 2 | 2 | 1,356 | 6,864 | $487 | $660,000 | 36 | 84 |
| 1432 J | Ontario | 1963 | 3 | 2 | 1,500 | 7,620 | $433 | $650,000 | 31 | 83 |
| Total: 5 · Average | 2.8 | 2.0 | 1,208.8 | 7,392.4 | $578.6 | $669,598 | 22.6 | |||
| Median | 1,312 | $669,990 | ||||||||
Closed Properties (5)
Closed Comparables
| Address | City | Year | Date | BD | BTH | SqFt | LotSz | LP | SP | SP/SqFt | SP/LP | DIM | Score |
|---|---|---|---|---|---|---|---|---|---|---|---|---|---|
| 924 E | Ontario | 1955 | 06/03/2026 | 3 | 2 | 1,254 | 7,245 | $699,999 | $675,000 | $538 | 0.96 | 194 | 91 |
| 1540 D | Ontario | 1954 | 05/05/2026 | 3 | 2 | 1,204 | 6,426 | $599,900 | $560,000 | $465 | 0.93 | 46 | 91 |
| 1054 Hollowell Street | Ontario | 1952 | 07/18/2026 | 3 | 2 | 1,034 | 8,208 | $688,000 | $683,000 | $661 | 0.99 | 37 | 91 |
| 1359 West Granada Court | Ontario | 1961 | 10/06/2026 | 3 | 2 | 1,288 | 7,242 | $639,900 | $633,000 | $491 | 0.99 | 33 | 90 |
| 516 Begonia Avenue | Ontario | 1954 | 06/11/2026 | 5 | 2 | 1,250 | 6,448 | $699,000 | $705,000 | $564 | 1.01 | 62 | 90 |
| Total: 5 · Average | 3.4 | 2.0 | 1,206 | 7,113.8 | $651,200 | $651,200 | $543.8 | — | 74.4 | ||||
| Median | 1,250 | $675,000 | $675,000 | ||||||||||
Market Analysis
List vs Sale $/SqFt
Sale Price Trend
Days on Market
Sale vs List Price
This analysis was generated automatically from MLS data. For an in-depth, human-reviewed valuation, contact Joseph Sardella at josephsardella@gmail.com.