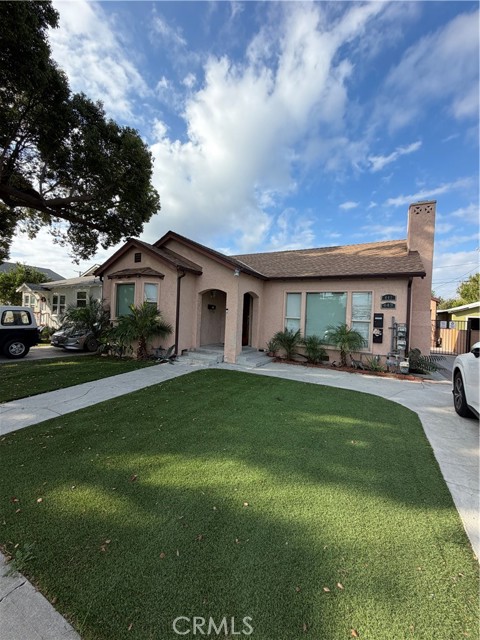
1 / 14
441 South Main, Burbank, CA 91506
$2.29M6bd · 5ba · 3,040 sqft
Lot 6,112 sqft•Single Family Residence•Active•6d on market•MLS# BB-26232596
441 South Main, Burbank, CA 91506
MLS# BB-26232596•Residential•Single Family Residence
Active6 days on market
$2,295,000
6
Beds
5
Baths
3,040
Sq Ft
6,112
Lot Sq Ft
1938
Year Built
None
View
Property Description
Gorgious single family house with 3 bed2 baths with 1500sqf and an ADU with 2 bed 2 baths with 880sqf and a Jdu with 1 bed 1 bath with 660 sqf located on a disirable location right by the studios with generating approximatly income of $9500. per mont . It could be an investment property or live in one and rent the others .
Features & Amenities
FeeBuilt 1938
Property Details
Land Type
Fee
Year Built
1938
Property Type
Residential
Property Subtype
Single Family Residence
Parking Spaces
0
Garage Spaces
0
Cooling
Central Air, Electric, Gas
View
None
City
Burbank
Zip Code
91506
County
Los Angeles
Mortgage Calculator
Current Rates
$
$
%
Monthly Payment
$11,604.77
Principal & Interest
Loan Amount
$1,836,000
Total Interest
$2,341,717
Total Payment Over 30 Years
$4,177,717
This calculator provides estimates only. Actual mortgage payments may include taxes, insurance, HOA fees, and PMI. Contact a lender for accurate quotes.
Comparative Market Analysis
Luxury Tier · 5 active · 5 closed
441 South Main, Burbank, CA 91506
Burbank · Single Family Residence
$2.29M
Luxury TierBeds
6
Baths
5
Sqft
3,040
Lot
6,112 sqft
Year
1938
$/Sqft
$755
Pool: No✓
View: None✓
Listed in line with the median closed sale of $2,299,000. Luxury tier — fewer comparable sales widen the confidence range.
Price Position
Aligned with the market — fair pricing for the comps.
At market
Subject listed at $2.29M· $755/sqft
Total list price
Closed comps
vs closed median $2.30M
−$4K (−0.2%)
Active comps
vs active median $2.25M
+$45K (+2.0%)
Price per sqft
Closed compsinsufficient comp data
Active comps
vs active avg $/sqft $766
−$11 (−1.5%)
Active Properties (5)
Active Comparables
| Address | City | Year | BD | BTH | SqFt | LotSz | LP/SqFt | LP | DIM | Score |
|---|---|---|---|---|---|---|---|---|---|---|
| 409 Avon | Burbank | 1947 | 7 | 3 | 2,835 | 5,606 | $704 | $2.00M | 40 | 74 |
| 618 Pass | Burbank | 1941 | 7 | 5 | 2,524 | 6,413 | $782 | $1.98M | 130 | 73 |
| 1025 E San Jose Ave | Burbank | 1938 | 6 | 6 | 4,481 | 7,469 | $557 | $2.50M | 76 | 65 |
| 1051 Verdugo Avenue | Burbank | 1923 | 4 | 4 | 3,097 | 7,752 | $727 | $2.25M | 19 | 64 |
| 902 WALNUT Avenue | Burbank | 1947 | 4 | 4 | 2,356 | 9,321 | $1,061 | $2.50M | 111 | 48 |
| Total: 5 · Average | 5.6 | 4.4 | 3,058.6 | 7,312.2 | $766.2 | $2.24M | 75.2 | |||
| Median | 2,835 | $2.25M | ||||||||
Closed Properties (5)
Closed Comparables
| Address | City | Year | Date | BD | BTH | SqFt | LotSz | LP | SP | SP/SqFt | SP/LP | DIM | Score |
|---|---|---|---|---|---|---|---|---|---|---|---|---|---|
| 314 Orchard Drive | Burbank | 2014 | 09/09/2026 | 5 | 4 | 3,008 | 6,420 | $2.30M | $2.30M | $765 | 1.00 | 105 | 86 |
| 335 Parish Place | Burbank | 1938 | 07/21/2026 | 4 | 3 | 2,622 | 6,689 | $2.20M | $2.20M | $839 | 1.00 | 33 | 75 |
| 437 Sparks | Burbank | 1985 | 05/20/2026 | 4 | 4 | 4,118 | 7,215 | $2.30M | $2.30M | $558 | 1.00 | 46 | 74 |
| 420 Reese Place | Burbank | 1968 | 08/28/2026 | 4 | 3 | 2,780 | 7,522 | $2.10M | $2.10M | $754 | 1.00 | 28 | 72 |
| 1622 Oak | Burbank | 1970 | 06/25/2026 | 5 | 4 | 3,085 | 8,199 | $2.59M | $2.59M | $839 | 1.00 | 71 | 69 |
| Total: 5 · Average | 4.4 | 3.6 | 3,122.6 | 7,209 | $2.30M | $2.30M | $751 | — | 56.6 | ||||
| Median | 3,008 | $2.30M | $2.30M | ||||||||||
Market Analysis
List vs Sale $/SqFt
Sale Price Trend
Days on Market
Sale vs List Price
AI-generated CMA
This analysis was generated automatically from MLS data. For an in-depth, human-reviewed valuation, contact Joseph Sardella at josephsardella@gmail.com.