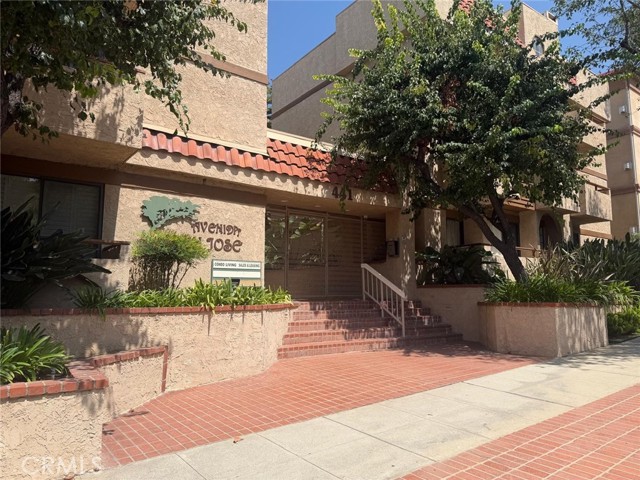
441 East San Jose, 309, Burbank, CA 91501
441 East San Jose, 309, Burbank, CA 91501
Property Description
A fantastic opportunity to personalize and remodel a home exactly to your vision in a well-located Burbank community. This top-floor, 3-bedroom, 2-bathroom condo features a desirable single-level layout, a sense of privacy, and plenty of potential to create a home that truly feels like your own. Located at the end of the walkway, the upper-level location provides added privacy and a peaceful setting. The property also includes two assigned subterranean parking spaces, providing both convenience and security. With its spacious layout and character, this condo presents an exciting renovation opportunity for investors, contractors, or buyers looking to transform the property into a modern, custom retreat. Bring your vision and create something special in one of Los Angeles County's most desirable communities.
Features & Amenities
Property Details
Mortgage Calculator
Current Rates
Comparative Market Analysis
Affordable Tier · 5 active · 5 closed
Burbank · Condominium
Listed 8.3% below the median closed sale of $703,000. Price per sqft ($474) is a 18% discount to closed comps ($577). Closed comps sold at 100% of list — strong seller's market.
Price Position
Priced below the market — value advantage over the field.
Active Properties (5)
Active Comparables
| Address | City | Year | BD | BTH | SqFt | LotSz | LP/SqFt | LP | DIM | Score |
|---|---|---|---|---|---|---|---|---|---|---|
| 441 San Jose | Burbank | 1981 | 2 | 2 | 1,222 | 28,230 | $588 | $719,000 | 96 | 93 |
| 635 Elmwood Avenue | Burbank | 1980 | 2 | 2 | 1,248 | 18,101 | $573 | $715,000 | 6 | 86 |
| 519 Providencia Avenue | Burbank | 1975 | 2 | 2 | 1,116 | 6,991 | $538 | $600,000 | 2 | 78 |
| 250 First Street | Burbank | 2007 | 2 | 2 | 1,100 | 84,242 | $654 | $719,000 | 29 | 78 |
| 1515 Grismer | Burbank | 2007 | 2 | 2 | 1,020 | 10,922 | $618 | $629,900 | 19 | 74 |
| Total: 5 · Average | 2.0 | 2.0 | 1,141.2 | 29,697.2 | $594.2 | $676,580 | 30.4 | |||
| Median | 1,116 | $715,000 | ||||||||
Closed Properties (5)
Closed Comparables
| Address | City | Year | Date | BD | BTH | SqFt | LotSz | LP | SP | SP/SqFt | SP/LP | DIM | Score |
|---|---|---|---|---|---|---|---|---|---|---|---|---|---|
| 456 San Jose Avenue | Burbank | 1981 | 07/10/2026 | 2 | 2 | 1,365 | 20,390 | $725,000 | $720,000 | $527 | 0.99 | 38 | 94 |
| 456 San Jose | Burbank | 1981 | 07/02/2026 | 2 | 2 | 1,262 | 20,390 | $699,000 | $703,000 | $557 | 1.01 | 36 | 92 |
| 456 San Jose | Burbank | 1981 | 03/17/2026 | 2 | 2 | 1,131 | 20,390 | $600,000 | $650,000 | $575 | 1.08 | 60 | 88 |
| 436 Palm Avenue | Burbank | 1980 | 05/11/2026 | 2 | 2 | 1,016 | 34,092 | $659,000 | $640,000 | $630 | 0.97 | 83 | 85 |
| 626 Orange Grove Avenue | Burbank | 2005 | 09/16/2026 | 3 | 3 | 1,200 | 15,273 | $748,000 | $715,000 | $596 | 0.96 | 128 | 83 |
| Total: 5 · Average | 2.2 | 2.2 | 1,194.8 | 22,107 | $685,600 | $685,600 | $577 | — | 69 | ||||
| Median | 1,200 | $703,000 | $703,000 | ||||||||||
Market Analysis
List vs Sale $/SqFt
Sale Price Trend
Days on Market
Sale vs List Price
This analysis was generated automatically from MLS data. For an in-depth, human-reviewed valuation, contact Joseph Sardella at josephsardella@gmail.com.