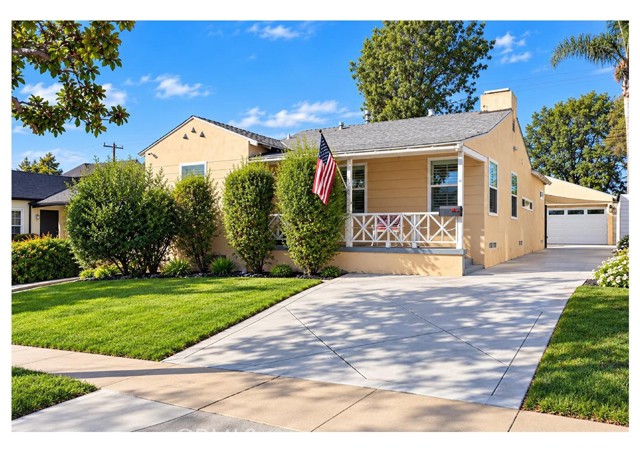
439 West Hillsdale, Inglewood, CA 90302
439 West Hillsdale, Inglewood, CA 90302
Property Description
Welcome to 439 W Hillsdale St, a charming Inglewood home offering 2 bedrooms and 2 bathrooms with a bright, inviting layout and plenty of character. The home features an updated kitchen, comfortable living spaces, a spacious driveway, and a private backyard perfect for relaxing, entertaining, or enjoying Southern California living. Conveniently located near shopping, dining, transportation, and everything Inglewood has to offer.
Features & Amenities
Property Details
Mortgage Calculator
Current Rates
Comparative Market Analysis
Affordable Tier · 5 active · 5 closed
Inglewood · Single Family Residence
Listed in line with the median closed sale of $918,185. Price per sqft ($885) is a 16% premium to closed comps ($763). Closed comps sold at 103% of list — strong seller's market.
Price Position
Aligned with the market — fair pricing for the comps.
Active Properties (5)
Active Comparables
| Address | City | Year | BD | BTH | SqFt | LotSz | LP/SqFt | LP | DIM | Score |
|---|---|---|---|---|---|---|---|---|---|---|
| 624 Beach Avenue | Inglewood | 1949 | 4 | 2 | 1,182 | 4,390 | $761 | $899,900 | 65 | 77 |
| 328 Plymouth Street | Inglewood | 1953 | 3 | 2 | 1,436 | 7,518 | $623 | $895,000 | 173 | 68 |
| 332 Plymouth Street | Inglewood | 1951 | 3 | 2 | 1,650 | 6,752 | $576 | $950,000 | 86 | 65 |
| 7361 Flight Avenue | Los Angeles | 1987 | 2 | 2 | 1,836 | 6,000 | $531 | $975,000 | 30 | 58 |
| 117 Plymouth | Inglewood | 2026 | 3 | 4 | 1,650 | 1,536 | $561 | $925,000 | 118 | 54 |
| Total: 5 · Average | 3.0 | 2.4 | 1,550.8 | 5,239.2 | $610.4 | $928,980 | 94.4 | |||
| Median | 1,650 | $925,000 | ||||||||
Closed Properties (5)
Closed Comparables
| Address | City | Year | Date | BD | BTH | SqFt | LotSz | LP | SP | SP/SqFt | SP/LP | DIM | Score |
|---|---|---|---|---|---|---|---|---|---|---|---|---|---|
| 440 Ellis Avenue | Inglewood | 1936 | 10/08/2026 | 2 | 2 | 1,250 | 5,397 | $899,999 | $918,185 | $735 | 1.02 | 35 | 88 |
| 320 64th Street | Inglewood | 1947 | 07/31/2026 | 2 | 1 | 1,364 | 6,419 | $825,999 | $887,000 | $650 | 1.07 | 67 | 82 |
| 6235 Condon | Los Angeles | 1948 | 10/08/2026 | 2 | 2 | 1,412 | 7,707 | $875,000 | $967,000 | $685 | 1.10 | 46 | 76 |
| 1206 La Brea Avenue | Inglewood | 1925 | 04/28/2026 | 2 | 2 | 796 | 3,301 | $835,000 | $835,000 | $1,049 | 1.00 | 69 | 76 |
| 121 Fairview | Inglewood | 1926 | 04/23/2026 | 3 | 2 | 1,507 | 5,977 | $1.07M | $1.05M | $697 | 0.98 | 105 | 70 |
| Total: 5 · Average | 2.2 | 1.8 | 1,265.8 | 5,760.2 | $931,437 | $931,437 | $763.2 | — | 64.4 | ||||
| Median | 1,364 | $918,185 | $918,185 | ||||||||||
Market Analysis
List vs Sale $/SqFt
Sale Price Trend
Days on Market
Sale vs List Price
This analysis was generated automatically from MLS data. For an in-depth, human-reviewed valuation, contact Joseph Sardella at josephsardella@gmail.com.