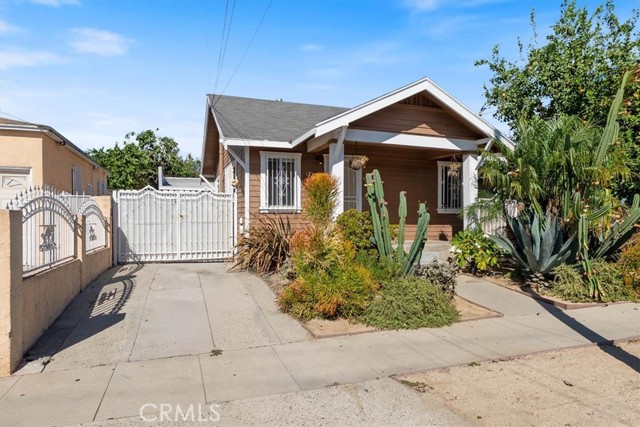
439 East 98th, Inglewood, CA 90301
439 East 98th, Inglewood, CA 90301
Property Description
This classic California bungalow has been refreshed throughout and is ready for its next owner. New waterproof laminate floors run through every room, with fresh paint on the walls, ceilings, doors, trim, and cabinetry. A covered front porch and low-maintenance, drought-tolerant landscaping make a clean first impression. The south-facing living room is bright and air-conditioned. The kitchen pairs crisp white cabinetry with a stainless gas range and hood, a double sink, and a breakfast table, plus a door straight out to the backyard. Two bedrooms share an updated bathroom. Out back, the fully fenced patio gives you room to host, grill, or unwind. It leads to a detached bonus room with its own entrance, a sliding glass door, new floors and lighting, wall A/C, a kitchenette, and a full bathroom with a walk-in shower. Set it up as a home office, gym, or studio. A long paved side yard behind the front gate adds space for storage or projects. Within walking distance of SoFi Stadium and the Kia Forum, and just minutes away from LAX, with quick access to the 105 and 405.
Features & Amenities
Property Details
Mortgage Calculator
Current Rates
Comparative Market Analysis
Affordable Tier · 5 active · 5 closed
Inglewood · Single Family Residence
Listed 9.9% below the median closed sale of $655,000.
Price Position
Priced below the market — value advantage over the field.
Active Properties (5)
Active Comparables
| Address | City | Year | BD | BTH | SqFt | LotSz | LP/SqFt | LP | DIM | Score |
|---|---|---|---|---|---|---|---|---|---|---|
| 6812 Van Ness | Los Angeles | 1930 | 2 | 1 | 914 | 2,499 | $585 | $535,000 | 20 | 62 |
| 3304 63rd | Los Angeles | 1922 | 2 | 1 | 780 | 5,400 | $692 | $540,000 | 113 | 61 |
| 2922 74th Street | Los Angeles | 1922 | 2 | 1 | 896 | 6,705 | $692 | $619,900 | 27 | 60 |
| 1433 96th | Los Angeles | 1924 | 2 | 2 | 750 | 4,901 | $813 | $609,900 | 10 | 60 |
| 909 Brett Street | Inglewood | 1923 | 2 | 1 | 864 | 5,607 | $763 | $659,000 | 44 | 60 |
| Total: 5 · Average | 2.0 | 1.2 | 840.8 | 5,022.4 | $709 | $592,760 | 42.8 | |||
| Median | 864 | $609,900 | ||||||||
Closed Properties (5)
Closed Comparables
| Address | City | Year | Date | BD | BTH | SqFt | LotSz | LP | SP | SP/SqFt | SP/LP | DIM | Score |
|---|---|---|---|---|---|---|---|---|---|---|---|---|---|
| 115 Hardy | Inglewood | 1925 | 10/09/2026 | 2 | 1 | 748 | 3,060 | $620,000 | $635,000 | $849 | 1.02 | 30 | 87 |
| 543 Olive | Inglewood | 1926 | 07/01/2026 | 2 | 1 | 624 | 3,033 | $655,000 | $655,000 | $1,050 | 1.00 | 141 | 81 |
| 3826 115th | Hawthorne | 1930 | 08/05/2026 | 2 | 1 | 560 | 6,005 | $675,000 | $655,000 | $1,170 | 0.97 | 118 | 79 |
| 10624 Burl | Inglewood | 1937 | 06/16/2026 | 1 | 1 | 528 | 4,281 | $625,000 | $625,000 | $1,184 | 1.00 | 52 | 78 |
| 400 Buckthorn Street | Inglewood | 1926 | 04/27/2026 | 2 | 1 | 908 | 3,625 | $675,000 | $665,000 | $732 | 0.98 | 121 | 77 |
| Total: 5 · Average | 1.8 | 1.0 | 673.6 | 4,000.8 | $647,000 | $647,000 | $997 | — | 92.4 | ||||
| Median | 624 | $655,000 | $655,000 | ||||||||||
Market Analysis
List vs Sale $/SqFt
Sale Price Trend
Days on Market
Sale vs List Price
This analysis was generated automatically from MLS data. For an in-depth, human-reviewed valuation, contact Joseph Sardella at josephsardella@gmail.com.