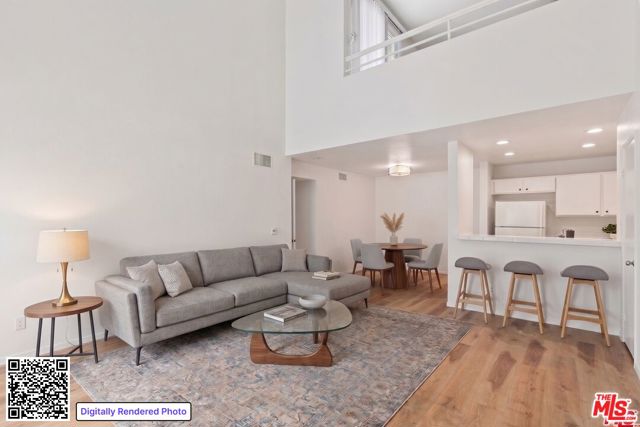
438 East Spruce Avenue, 141, Inglewood, CA 90301
438 East Spruce Avenue, 141, Inglewood, CA 90301
Property Description
Clean, light and bright 1 Bedroom + Loft & 1 Bathroom top floor unit in a great Inglewood location! Open concept living with large living room w/fireplace, vaulted ceilings, dining area and kitchen with breakfast bar. Upstairs loft could be used as another bedroom or as an at home office. Off the loft is a large rooftop deck perfect for entertaining. Large master bedroom with bathroom and walk in closet. Unit features newer plank flooring, central heat/air, a large balcony off the living room & bedroom, 2 car tandem parking and more! Great gated, secure complex with pool! Great location across the street from Vons w/ Starbucks and close to Downtown Inglewood, SOFI stadium, Intuit Dome, Hollywood Park and The Forum!
Features & Amenities
Property Details
Mortgage Calculator
Current Rates
Comparative Market Analysis
Affordable Tier · 5 active · 5 closed
Inglewood · Condominium
Listed 4.8% above the median closed sale of $420,000.
Price Position
Aligned with the market — fair pricing for the comps.
Active Properties (5)
Active Comparables
| Address | City | Year | BD | BTH | SqFt | LotSz | LP/SqFt | LP | DIM | Score |
|---|---|---|---|---|---|---|---|---|---|---|
| 8712 Chessington Drive | Inglewood | 1987 | 2 | 2 | 952 | 41,882 | $523 | $498,000 | 306 | 83 |
| 620 Hyde Park Boulevard | Inglewood | 1983 | 2 | 2 | 1,031 | 65,895 | $446 | $460,000 | 59 | 79 |
| 324 Plymouth Street | Inglewood | 1987 | 2 | 2 | 850 | 27,748 | $587 | $499,000 | 108 | 76 |
| 610 Venice | Inglewood | 1990 | 2 | 2 | 869 | 28,718 | $541 | $470,000 | 6 | 76 |
| 805 Glenway Drive | Inglewood | 1964 | 2 | 2 | 943 | 49,676 | $477 | $450,000 | 8 | 75 |
| Total: 5 · Average | 2.0 | 2.0 | 929 | 42,783.8 | $514.8 | $475,400 | 97.4 | |||
| Median | 943 | $470,000 | ||||||||
Closed Properties (5)
Closed Comparables
| Address | City | Year | Date | BD | BTH | SqFt | LotSz | LP | SP | SP/SqFt | SP/LP | DIM | Score |
|---|---|---|---|---|---|---|---|---|---|---|---|---|---|
| 433 Tamarack | Inglewood | 1989 | 10/22/2026 | 1 | 1 | 941 | 61,198 | $484,999 | $475,000 | $505 | 0.98 | 69 | 92 |
| 3814 Dunford | Inglewood | 1987 | 07/15/2026 | 2 | 1 | 845 | 99,402 | $395,999 | $390,000 | $462 | 0.98 | 162 | 85 |
| 434 Spruce | Inglewood | 1989 | 06/12/2026 | 1 | 1 | 701 | 55,620 | $429,999 | $420,000 | $599 | 0.98 | 91 | 77 |
| 114 Eucalyptus Avenue | Inglewood | 1963 | 08/07/2026 | 2 | 2 | 956 | 7,998 | $395,000 | $395,000 | $413 | 1.00 | 75 | 76 |
| 218 Tamarack Avenue | Inglewood | 1965 | 11/10/2025 | 2 | 2 | 943 | 21,226 | $459,500 | $440,000 | $467 | 0.96 | 124 | 75 |
| Total: 5 · Average | 1.6 | 1.4 | 877.2 | 49,088.8 | $424,000 | $424,000 | $489.2 | — | 104.2 | ||||
| Median | 941 | $420,000 | $420,000 | ||||||||||
Market Analysis
List vs Sale $/SqFt
Sale Price Trend
Days on Market
Sale vs List Price
This analysis was generated automatically from MLS data. For an in-depth, human-reviewed valuation, contact Joseph Sardella at josephsardella@gmail.com.