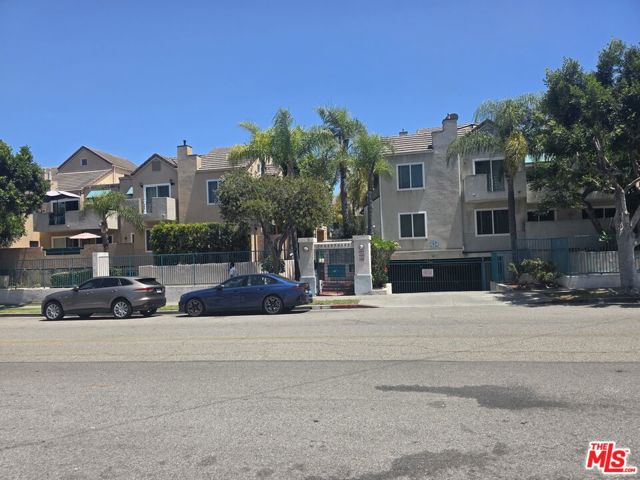
438 East Spruce Avenue, 133, Inglewood, CA 90301
438 East Spruce Avenue, 133, Inglewood, CA 90301
Property Description
This beautiful, delightful and spacious condo is minutes away from so many entertainment hubs including the Kia Forum, Sofi Stadium and the Intuit Dome. This well kept condo features an Open Floor Plan, has vaulted ceilings, beautiful kitchen; updated bathroom; bedroom / den on 1st level. The loft can be used as an additional bedroom or office, complete with a large closet and balcony. The property includes updated dual pane windows, in-unit laundry, underground tandem parking (2 cars). This property is move-in ready and has so much to offer.
Features & Amenities
Property Details
Mortgage Calculator
Current Rates
Comparative Market Analysis
Affordable Tier · 5 active · 5 closed
Inglewood · Condominium
Listed 7.6% below the median closed sale of $557,500. Expect a longer timeline — comps averaged 140 days on market.
Price Position
Priced below the market — value advantage over the field.
Active Properties (5)
Active Comparables
| Address | City | Year | BD | BTH | SqFt | LotSz | LP/SqFt | LP | DIM | Score |
|---|---|---|---|---|---|---|---|---|---|---|
| 438 Spruce Avenue | Inglewood | 1989 | 2 | 1 | 941 | 61,198 | $468 | $440,000 | 45 | 94 |
| 8730 Beckenham | Inglewood | 1986 | 2 | 2 | 1,041 | 98,778 | $500 | $520,000 | 16 | 83 |
| 8712 Chessington Drive | Inglewood | 1987 | 2 | 2 | 952 | 41,882 | $523 | $498,000 | 306 | 82 |
| 8701 Chessington Drive | Inglewood | 1987 | 2 | 2 | 1,041 | 99,402 | $527 | $549,000 | 9 | 82 |
| 3859 Thorncroft Lane | Inglewood | 1986 | 2 | 2 | 1,041 | 108,793 | $552 | $575,000 | 90 | 80 |
| Total: 5 · Average | 2.0 | 1.8 | 1,003.2 | 82,010.6 | $514 | $516,400 | 93.2 | |||
| Median | 1,041 | $520,000 | ||||||||
Closed Properties (5)
Closed Comparables
| Address | City | Year | Date | BD | BTH | SqFt | LotSz | LP | SP | SP/SqFt | SP/LP | DIM | Score |
|---|---|---|---|---|---|---|---|---|---|---|---|---|---|
| 433 Tamarack | Inglewood | 1989 | 10/22/2026 | 1 | 1 | 941 | 61,198 | $484,999 | $475,000 | $505 | 0.98 | 69 | 97 |
| 430 Spruce | Inglewood | 1989 | 12/30/2025 | 2 | 3 | 893 | 55,620 | $579,000 | $589,000 | $660 | 1.02 | 29 | 79 |
| 3867 Thorncroft Lane | Inglewood | 1986 | 06/01/2026 | 2 | 2 | 1,128 | 105,409 | $579,000 | $570,000 | $505 | 0.98 | 194 | 76 |
| 218 Tamarack Avenue | Inglewood | 1965 | 11/10/2025 | 2 | 2 | 943 | 21,226 | $459,500 | $440,000 | $467 | 0.96 | 124 | 73 |
| 8726 Beckenham Lane | Inglewood | 1986 | 06/10/2026 | 3 | 2 | 1,199 | 98,778 | $565,000 | $557,500 | $465 | 0.99 | 285 | 72 |
| Total: 5 · Average | 2.0 | 2.0 | 1,020.8 | 68,446.2 | $526,300 | $526,300 | $520.4 | — | 140.2 | ||||
| Median | 943 | $557,500 | $557,500 | ||||||||||
Market Analysis
List vs Sale $/SqFt
Sale Price Trend
Days on Market
Sale vs List Price
This analysis was generated automatically from MLS data. For an in-depth, human-reviewed valuation, contact Joseph Sardella at josephsardella@gmail.com.