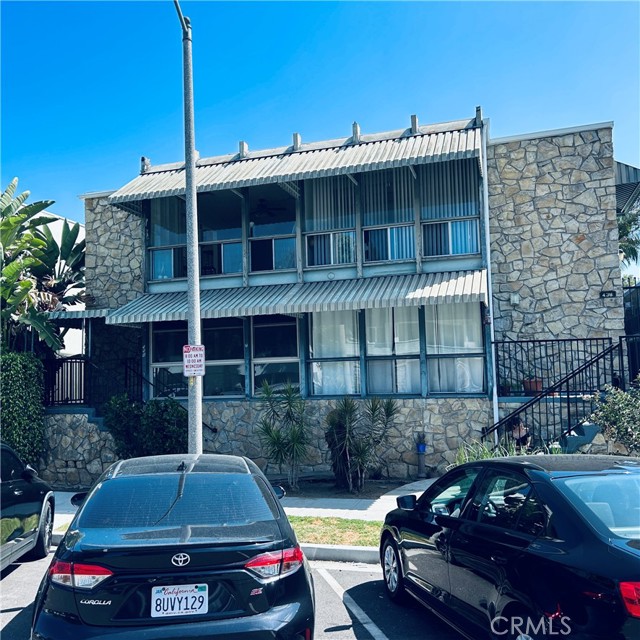
438 Cedar, Long Beach, CA 90802
438 Cedar, Long Beach, CA 90802
Property Description
*** $30,000 price reduction*** Downtown Long Beach offers an historic area with walking distance to Metro train station, Beach, retail shopping, a laundromat about a block away. bars restaurants, Aquarium, Grand prix, close to the freeway and much more. A large one bedroom for the area (almost 900 sqft) with 2 walk-in closets in the bedroom and other storage areas. A one car subterranean parking is included, along with limited street parking. Heating is a wall furnace in the unit and hot water is provided by a large boiler for the building. There are separate electric and gas meters for the unit, but trash and maintenance are covered by the relatively low HOA dues.
Features & Amenities
Property Details
Mortgage Calculator
Current Rates
Comparative Market Analysis
Affordable Tier · 5 active · 5 closed
Long Beach · Condominium
Listed 3.2% above the median closed sale of $339,000. Price per sqft ($412) is a 19% discount to closed comps ($510).
Price Position
Aligned with the market — fair pricing for the comps.
Active Properties (5)
Active Comparables
| Address | City | Year | BD | BTH | SqFt | LotSz | LP/SqFt | LP | DIM | Score |
|---|---|---|---|---|---|---|---|---|---|---|
| 438 Cedar | Long Beach | 1957 | 1 | 1 | 748 | 15,007 | $455 | $340,000 | 44 | 95 |
| 527 Cedar Avenue | Long Beach | 1961 | 2 | 1 | 809 | 15,006 | $445 | $360,000 | 3 | 93 |
| 728 Cedar | Long Beach | 1956 | 1 | 1 | 611 | 15,036 | $538 | $329,000 | 4 | 88 |
| 545 Chestnut Avenue | Long Beach | 1972 | 1 | 1 | 666 | 20,550 | $477 | $317,888 | 18 | 87 |
| 335 Cedar Ave #315 | Long Beach | 1965 | 2 | 2 | 937 | 14,978 | $427 | $399,999 | 107 | 85 |
| Total: 5 · Average | 1.4 | 1.2 | 754.2 | 16,115.4 | $468.4 | $349,377.4 | 35.2 | |||
| Median | 748 | $340,000 | ||||||||
Closed Properties (5)
Closed Comparables
| Address | City | Year | Date | BD | BTH | SqFt | LotSz | LP | SP | SP/SqFt | SP/LP | DIM | Score |
|---|---|---|---|---|---|---|---|---|---|---|---|---|---|
| 528 Cedar Boulevard | Long Beach | 1960 | 06/05/2026 | 1 | 1 | 812 | 17,363 | $329,000 | $315,000 | $388 | 0.96 | 60 | 94 |
| 527 Cedar Avenue | Long Beach | 1961 | 02/12/2026 | 1 | 1 | 597 | 15,006 | $339,000 | $333,000 | $558 | 0.98 | 75 | 85 |
| 438 Cedar | Long Beach | 1957 | 02/10/2026 | 1 | 1 | 574 | 15,007 | $389,000 | $389,000 | $678 | 1.00 | 34 | 84 |
| 350 Cedar Avenue | Long Beach | 1971 | 03/03/2026 | 1 | 1 | 667 | 10,635 | $339,000 | $339,000 | $508 | 1.00 | 49 | 82 |
| 545 Chestnut | Long Beach | 1972 | 04/24/2026 | 2 | 2 | 926 | 20,550 | $399,000 | $385,000 | $416 | 0.96 | 109 | 81 |
| Total: 5 · Average | 1.2 | 1.2 | 715.2 | 15,712.2 | $352,200 | $352,200 | $509.6 | — | 65.4 | ||||
| Median | 667 | $339,000 | $339,000 | ||||||||||
Market Analysis
List vs Sale $/SqFt
Sale Price Trend
Days on Market
Sale vs List Price
This analysis was generated automatically from MLS data. For an in-depth, human-reviewed valuation, contact Joseph Sardella at josephsardella@gmail.com.