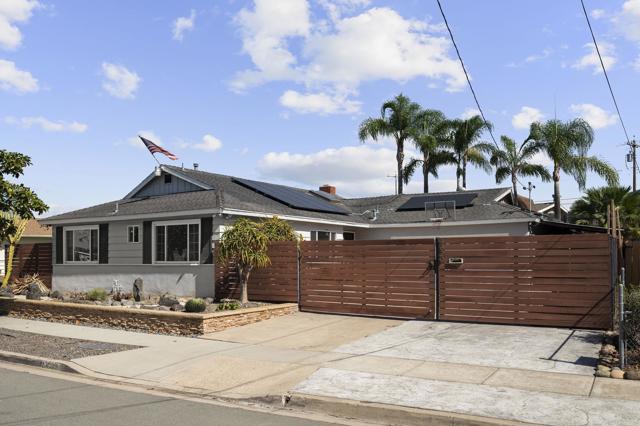
4329 Mount Henry Avenue, Clairemont Mesa, CA 92117
4329 Mount Henry Avenue, Clairemont Mesa, CA 92117
Property Description
Darling and inviting, the move-in-ready Clairemont home blends comfortable living with effortless indoor-outdoor appeal. Beautiful hardwood floors, abundant natural light and an open-concept living, dining and kitchen area create a bright, welcoming atmosphere. Offering 3 bedrooms and 2 baths, solar, and freshly resurfaced pool, this home is designed for easy living and entertaining. Gated and private, the outdoor setting features an inviting covered patio overlooking the pool - perfect for al fresco dining and relaxed gatherings with family and friends. A delightful place to call home!
Features & Amenities
Property Details
Mortgage Calculator
Current Rates
Comparative Market Analysis
Affordable Tier · 5 active · 5 closed
Clairemont Mesa · Single Family Residence
Listed 6.9% above the median closed sale of $1,295,000. Price per sqft ($1,178) is a 24% premium to closed comps ($949). Closed comps sold at 102% of list — strong seller's market.
Price Position
Positioned above the market — commands a premium.
Active Properties (5)
Active Comparables
| Address | City | Year | BD | BTH | SqFt | LotSz | LP/SqFt | LP | DIM | Score |
|---|---|---|---|---|---|---|---|---|---|---|
| 4121 Mount Hukee | San Diego | 1961 | 4 | 2 | 1,426 | 6,066 | $876 | $1.25M | 16 | 84 |
| 5333 Arlene St | San Diego | 1961 | 3 | 2 | 1,600 | 6,700 | $750 | $1.20M | 15 | 74 |
| 3575 Waco Street | San Diego | 1953 | 2 | 1 | 806 | 6,098 | $1,551 | $1.25M | 34 | 70 |
| 4789 Andalusia Avenue | San Diego | 1961 | 3 | 2 | 2,215 | 9,700 | $655 | $1.45M | 31 | 61 |
| 5442 Burford Street | San Diego | 1969 | 4 | 2 | 2,053 | 12,200 | $753 | $1.54M | 13 | 58 |
| Total: 5 · Average | 3.2 | 1.8 | 1,620 | 8,152.8 | $917 | $1.34M | 21.8 | |||
| Median | 1,600 | $1.25M | ||||||||
Closed Properties (5)
Closed Comparables
| Address | City | Year | Date | BD | BTH | SqFt | LotSz | LP | SP | SP/SqFt | SP/LP | DIM | Score |
|---|---|---|---|---|---|---|---|---|---|---|---|---|---|
| 4259 Mount Henry | San Diego | 1960 | 06/08/2026 | 3 | 2 | 1,352 | 6,300 | $1.23M | $1.25M | $928 | 1.02 | 25 | 89 |
| 5032 Mount Etna Drive | San Diego | 1958 | 07/20/2026 | 3 | 2 | 1,445 | 6,800 | $1.23M | $1.29M | $896 | 1.06 | 28 | 85 |
| 4304 Quapaw Avenue | San Diego | 1956 | 05/06/2026 | 3 | 2 | 1,044 | 6,400 | $1.45M | $1.45M | $1,389 | 1.00 | 29 | 82 |
| 4380 Rolfe Rd | San Diego | 1961 | 08/28/2026 | 3 | 2 | 1,658 | 5,600 | $1.25M | $1.25M | $754 | 1.00 | 52 | 82 |
| 3840 Tomahawk Lane | San Diego | 1953 | 12/23/2025 | 5 | 2 | 1,730 | 8,900 | $1.35M | $1.35M | $780 | 1.00 | 33 | 64 |
| Total: 5 · Average | 3.4 | 2.0 | 1,445.8 | 6,800 | $1.32M | $1.32M | $949.4 | — | 33.4 | ||||
| Median | 1,445 | $1.29M | $1.29M | ||||||||||
Market Analysis
List vs Sale $/SqFt
Sale Price Trend
Days on Market
Sale vs List Price
This analysis was generated automatically from MLS data. For an in-depth, human-reviewed valuation, contact Joseph Sardella at josephsardella@gmail.com.