420 North Market, 9, Inglewood, CA 90302
420 North Market, 9, Inglewood, CA 90302
Property Description
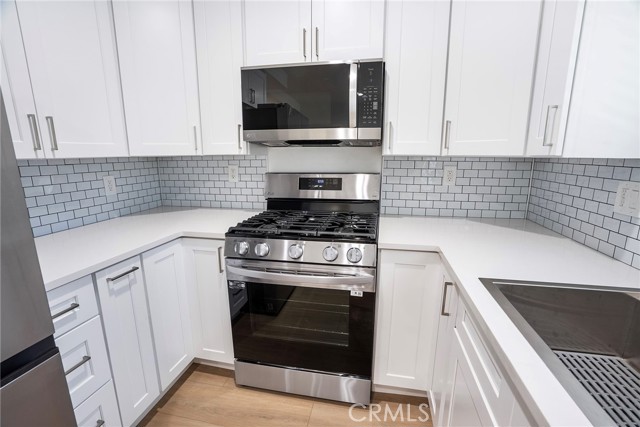
Welcome home to this fully remodeled 1-bedroom, 1-bathroom condo tucked away inside a secure, gated community. Designed for easy living and entertaining, the residence features a light-filled, open-concept living area and a sleek gourmet kitchen equipped for home chefs. The spacious bedroom serves as a quiet retreat with ample space to relax. Highlighting exceptional value with a remarkably low HOA fee of just $205 per month, this move-in-ready condo offers unmatched convenience with seamless freeway access and close proximity to top entertainment destinations, including SoFi Stadium and the Intuit Dome.
Features & Amenities
Property Details
Mortgage Calculator
Current Rates
Comparative Market Analysis
Affordable Tier · 5 active · 5 closed
Inglewood · Condominium
Listed in line with the median closed sale of $400,000. Price per sqft ($660) is a 62% premium to closed comps ($408). Expect a longer timeline — comps averaged 127 days on market.
Price Position
Aligned with the market — fair pricing for the comps.
Active Properties (5)
Active Comparables
| Address | City | Year | BD | BTH | SqFt | LotSz | LP/SqFt | LP | DIM | Score |
|---|---|---|---|---|---|---|---|---|---|---|
| 550 Regent | Inglewood | 1972 | 1 | 1 | 670 | 84,428 | $521 | $349,000 | 117 | 81 |
| 563 Hazel | Inglewood | 1962 | 2 | 2 | 840 | 20,026 | $500 | $419,900 | 36 | 74 |
| 756 Inglewood | Inglewood | 1969 | 2 | 2 | 953 | 24,982 | $472 | $450,000 | 45 | 72 |
| 500 Evergreen | Inglewood | 1965 | 2 | 2 | 906 | 29,133 | $464 | $420,000 | 47 | 72 |
| 805 Glenway Drive | Inglewood | 1964 | 2 | 2 | 943 | 49,676 | $477 | $450,000 | 8 | 68 |
| Total: 5 · Average | 1.8 | 1.8 | 862.4 | 41,649 | $486.8 | $417,780 | 50.6 | |||
| Median | 906 | $420,000 | ||||||||
Closed Properties (5)
Closed Comparables
| Address | City | Year | Date | BD | BTH | SqFt | LotSz | LP | SP | SP/SqFt | SP/LP | DIM | Score |
|---|---|---|---|---|---|---|---|---|---|---|---|---|---|
| 563 Hazel Street | Inglewood | 1962 | 05/01/2026 | 2 | 2 | 820 | 20,026 | $408,000 | $400,000 | $488 | 0.98 | 100 | 72 |
| 730 Eucalyptus Ave | Inglewood | 1972 | 09/28/2026 | 2 | 2 | 986 | 27,299 | $399,000 | $394,500 | $400 | 0.99 | 150 | 72 |
| 756 Inglewood Avenue | Inglewood | 1969 | 10/27/2026 | 2 | 2 | 976 | 24,982 | $400,000 | $400,000 | $410 | 1.00 | 97 | 70 |
| 730 Eucalyptus | Inglewood | 1972 | 07/27/2026 | 2 | 2 | 1,011 | 27,299 | $399,000 | $400,000 | $396 | 1.00 | 109 | 68 |
| 719 Eucalyptus Avenue | Inglewood | 1973 | 08/11/2026 | 2 | 2 | 1,059 | 67,430 | $360,000 | $365,000 | $345 | 1.01 | 180 | 60 |
| Total: 5 · Average | 2.0 | 2.0 | 970.4 | 33,407.2 | $391,900 | $391,900 | $407.8 | — | 127.2 | ||||
| Median | 986 | $400,000 | $400,000 | ||||||||||
Market Analysis
List vs Sale $/SqFt
Sale Price Trend
Days on Market
Sale vs List Price
This analysis was generated automatically from MLS data. For an in-depth, human-reviewed valuation, contact Joseph Sardella at josephsardella@gmail.com.