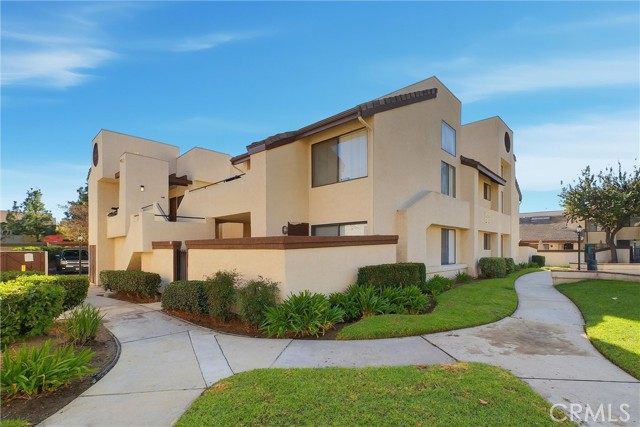
416 North Imperial Avenue, A, Ontario, CA 91764
416 North Imperial Avenue, A, Ontario, CA 91764
Property Description
Welcome to this turnkey one level condo in a quiet neighborhood in North Ontario. If you are looking to downsize or a starter home, don't missed this. Recent upgrades includes new floorings, painted throughout in a neutral color, furnace has been replaced mid 2024, Fridge and Gas Range are newer and new window treatments, new closet doors and new toilet bowl. This is a gated community, with 1 shared garage and 1 carport. There is a private patio with low maintenance, great for entertaining. Water and Trash, Roof and ground maintenance are included in the Hoa dues, there is also a nice swimming pool. Close to 10 Freeway.
Features & Amenities
Property Details
Mortgage Calculator
Current Rates
Comparative Market Analysis
Affordable Tier · 4 active · 5 closed
Ontario · Condominium
Listed 7.3% below the median closed sale of $372,000.
Price Position
Priced below the market — value advantage over the field.
Active Properties (4)
Active Comparables
| Address | City | Year | BD | BTH | SqFt | LotSz | LP/SqFt | LP | DIM | Score |
|---|---|---|---|---|---|---|---|---|---|---|
| 1325 San Diego | Ontario | 1971 | 2 | 1 | 816 | 3,220 | $472 | $385,000 | 34 | 82 |
| 920 Palmetto Avenue | Ontario | 1989 | 2 | 1 | 686 | 686 | $485 | $333,000 | 176 | 66 |
| 969 Mountain | Ontario | 1979 | 1 | 1 | 904 | 2,690 | $387 | $350,000 | 24 | 66 |
| 435 9th | Upland | 1979 | 2 | 2 | 951 | 951 | $410 | $390,000 | 65 | 63 |
| Total: 4 · Average | 1.8 | 1.3 | 839.25 | 1,886.75 | $438.5 | $364,500 | 74.75 | |||
| Median | 904 | $385,000 | ||||||||
Closed Properties (5)
Closed Comparables
| Address | City | Year | Date | BD | BTH | SqFt | LotSz | LP | SP | SP/SqFt | SP/LP | DIM | Score |
|---|---|---|---|---|---|---|---|---|---|---|---|---|---|
| 428 Imperial Avenue | Ontario | 1985 | 07/13/2026 | 2 | 1 | 752 | 2,000 | $329,800 | $323,000 | $430 | 0.98 | 52 | 97 |
| 1650 Campus | Ontario | 1985 | 05/28/2026 | 2 | 1 | 692 | 692 | $370,000 | $370,000 | $535 | 1.00 | 44 | 74 |
| 1814 Vineyard Avenue | Ontario | 1983 | 07/13/2026 | 2 | 2 | 1,232 | 2,000 | $399,900 | $372,000 | $302 | 0.93 | 81 | 66 |
| 8317 Vineyard | Rancho Cucamonga | 1988 | 02/04/2026 | 2 | 2 | 880 | 880 | $399,999 | $395,000 | $449 | 0.99 | 49 | 65 |
| 8333 Vineyard Ave | Rancho Cucamonga | 1988 | 12/29/2025 | 2 | 2 | 882 | 900 | $395,000 | $395,000 | $448 | 1.00 | 109 | 63 |
| Total: 5 · Average | 2.0 | 1.6 | 887.6 | 1,294.4 | $371,000 | $371,000 | $432.8 | — | 67 | ||||
| Median | 880 | $372,000 | $372,000 | ||||||||||
Market Analysis
List vs Sale $/SqFt
Sale Price Trend
Days on Market
Sale vs List Price
This analysis was generated automatically from MLS data. For an in-depth, human-reviewed valuation, contact Joseph Sardella at josephsardella@gmail.com.