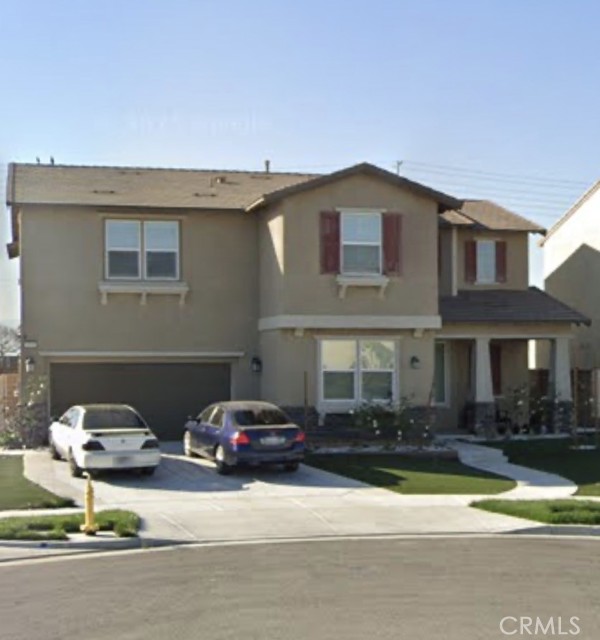
4140 South Bowery, Ontario, CA 91761
4140 South Bowery, Ontario, CA 91761
Property Description
Beautiful home located on a quiet cul-de-sac in the desirable Ontario Ranch community. This light-filled residence features an open-concept layout, modern kitchen with stainless steel appliances and large island, and a spacious primary suite with walk-in closet. Enjoy a private backyard, attached garage, and access to community amenities including parks and pools. Conveniently located near shopping, dining, and major freeways.
Features & Amenities
Property Details
Mortgage Calculator
Current Rates
Comparative Market Analysis
Luxury Tier · 5 active · 5 closed
Ontario · Single Family Residence
Listed 6.1% above the median closed sale of $848,000. Luxury tier — fewer comparable sales widen the confidence range.
Price Position
Positioned above the market — commands a premium.
Active Properties (5)
Active Comparables
| Address | City | Year | BD | BTH | SqFt | LotSz | LP/SqFt | LP | DIM | Score |
|---|---|---|---|---|---|---|---|---|---|---|
| 4010 Bowery | Ontario | 2022 | 5 | 4 | 3,173 | 5,414 | $309 | $980,000 | 282 | 93 |
| 3114 Yellowstone Drive | Ontario | 2019 | 5 | 3 | 2,765 | 4,599 | $302 | $835,000 | 69 | 87 |
| 2904 Merritt Paseo | Ontario | 2021 | 4 | 3 | 2,365 | 3,155 | $409 | $968,000 | 115 | 82 |
| 2863 Alberta Street | Ontario | 2019 | 3 | 3 | 2,016 | 3,959 | $384 | $775,000 | 107 | 81 |
| 2960 Merritt Paseo | Ontario | 2022 | 4 | 3 | 2,043 | 2,790 | $387 | $790,000 | 96 | 79 |
| Total: 5 · Average | 4.2 | 3.2 | 2,472.4 | 3,983.4 | $358.2 | $869,600 | 133.8 | |||
| Median | 2,365 | $835,000 | ||||||||
Closed Properties (5)
Closed Comparables
| Address | City | Year | Date | BD | BTH | SqFt | LotSz | LP | SP | SP/SqFt | SP/LP | DIM | Score |
|---|---|---|---|---|---|---|---|---|---|---|---|---|---|
| 4050 Bowery pl | Ontario | 2022 | 10/05/2026 | 4 | 3 | 2,532 | 5,440 | $799,999 | $833,000 | $329 | 1.04 | 50 | 93 |
| 3017 Grafton | Ontario | 2021 | 04/10/2026 | 5 | 4 | 3,173 | 6,120 | $989,000 | $900,000 | $284 | 0.91 | 58 | 91 |
| 3010 Bourbon Street | Ontario | 2021 | 05/22/2026 | 4 | 3 | 2,532 | 6,000 | $835,000 | $830,000 | $328 | 0.99 | 50 | 89 |
| 4043 Inglenook | Ontario | 2018 | 08/27/2026 | 4 | 3 | 3,105 | 4,050 | $850,000 | $848,000 | $273 | 1.00 | 193 | 88 |
| 3175 Yountville | Ontario | 2018 | 12/10/2025 | 4 | 3 | 3,105 | 4,828 | $878,000 | $900,000 | $290 | 1.02 | 26 | 88 |
| Total: 5 · Average | 4.2 | 3.2 | 2,889.4 | 5,287.6 | $862,200 | $862,200 | $300.8 | — | 75.4 | ||||
| Median | 3,105 | $848,000 | $848,000 | ||||||||||
Market Analysis
List vs Sale $/SqFt
Sale Price Trend
Days on Market
Sale vs List Price
This analysis was generated automatically from MLS data. For an in-depth, human-reviewed valuation, contact Joseph Sardella at josephsardella@gmail.com.