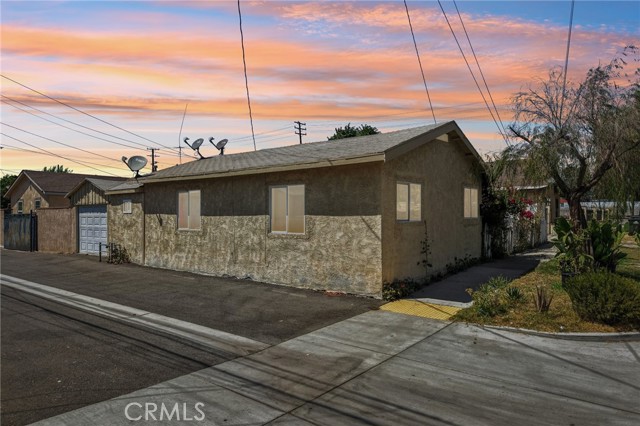
412 South Fern Avenue, Ontario, CA 91762
412 South Fern Avenue, Ontario, CA 91762
Property Description
Priced to sell & be in before the holidays! Ontario Awaits You! Welcome to this charming 2-bedroom, 1-bathroom home in a prime Ontario location! This property offers a comfortable layout with an inside laundry area conveniently located in the bathroom, upgraded windows, and a 1-car attached garage. Enjoy a fenced-in yard, perfect for outdoor entertaining, gardening, or simply relaxing. Ideally located near Ontario International Airport, the 10 and 60 freeways, Downtown Ontario, local schools, and Ontario Mills, making commuting, shopping, dining, and entertainment a breeze. Look no further—this is the perfect opportunity to make Ontario your home! Don't miss out; this one awaits you!
Features & Amenities
Property Details
Mortgage Calculator
Current Rates
Comparative Market Analysis
Affordable Tier · 1 active · 5 closed
Ontario · Single Family Residence
Listed in line with the median closed sale of $480,000. Price per sqft ($510) is a 15% discount to closed comps ($601).
Price Position
Aligned with the market — fair pricing for the comps.
Active Properties (1)
Active Comparables
| Address | City | Year | BD | BTH | SqFt | LotSz | LP/SqFt | LP | DIM | Score |
|---|---|---|---|---|---|---|---|---|---|---|
| 5187 Aspen Drive | Montclair | 1981 | 3 | 3 | 1,426 | 1,426 | $319 | $455,000 | 45 | 48 |
| Total: 1 · Average | 3.0 | 3.0 | 1,426 | 1,426 | $319 | $455,000 | 45 | |||
| Median | 1,426 | $455,000 | ||||||||
Closed Properties (5)
Closed Comparables
| Address | City | Year | Date | BD | BTH | SqFt | LotSz | LP | SP | SP/SqFt | SP/LP | DIM | Score |
|---|---|---|---|---|---|---|---|---|---|---|---|---|---|
| 610 Vine | Ontario | 1920 | 12/29/2025 | 2 | 1 | 702 | 2,790 | $500,000 | $410,000 | $584 | 0.82 | 88 | 81 |
| 210 Pleasant | Ontario | 1919 | 05/08/2026 | 2 | 1 | 696 | 2,576 | $475,000 | $480,000 | $690 | 1.01 | 56 | 81 |
| 1502 Pleasant | Ontario | 1952 | 05/26/2026 | 2 | 1 | 968 | 6,030 | $490,000 | $490,000 | $506 | 1.00 | 62 | 76 |
| 10033 Del Mar Avenue | Montclair | 1952 | 06/29/2026 | 2 | 1 | 876 | 8,246 | $480,000 | $450,000 | $514 | 0.94 | 48 | 72 |
| 548 State Street | Ontario | 1905 | 12/05/2025 | 2 | 1 | 738 | 6,185 | $499,999 | $525,000 | $711 | 1.05 | 58 | 72 |
| Total: 5 · Average | 2.0 | 1.0 | 796 | 5,165.4 | $471,000 | $471,000 | $601 | — | 62.4 | ||||
| Median | 738 | $480,000 | $480,000 | ||||||||||
Market Analysis
List vs Sale $/SqFt
Sale Price Trend
Days on Market
Sale vs List Price
This analysis was generated automatically from MLS data. For an in-depth, human-reviewed valuation, contact Joseph Sardella at josephsardella@gmail.com.