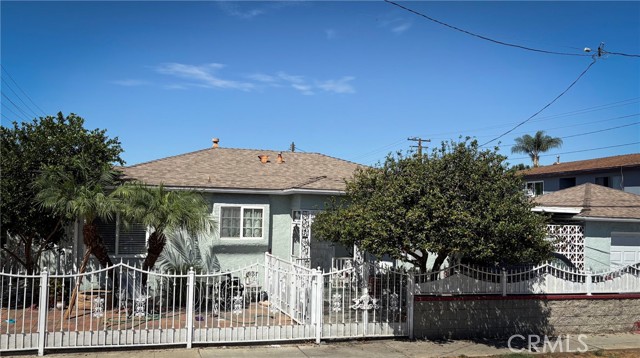
3929 East 56th Street, Maywood, CA 90270
3929 East 56th Street, Maywood, CA 90270
Property Description
This charming corner-lot home features 2 bedrooms and 1 bathroom, along with a 2-car garage and driveway parking. The property also offers a private patio and side yard with mature fruit trees, providing a comfortable outdoor space for relaxing or entertaining. An additional room, added without a permit, offers flexible space that may be used as an office, hobby room, or other personal-use area. The gated driveway provides the opportunity for additional off-street parking. The detached garage may offer potential for conversion to an ADU, subject to applicable permits, approvals, and buyer verification. The property is being sold as-is. Buyers are encouraged to conduct their own inspections and due diligence regarding the condition, zoning, and all other aspects of the property.
Features & Amenities
Property Details
Mortgage Calculator
Current Rates
Comparative Market Analysis
Affordable Tier · 5 active · 5 closed
Maywood · Single Family Residence
Listed in line with the median closed sale of $720,000.
Price Position
Aligned with the market — fair pricing for the comps.
Active Properties (5)
Active Comparables
| Address | City | Year | BD | BTH | SqFt | LotSz | LP/SqFt | LP | DIM | Score |
|---|---|---|---|---|---|---|---|---|---|---|
| 3700 55th | Maywood | 1920 | 2 | 1 | 884 | 4,597 | $825 | $729,000 | 5 | 85 |
| 3511 California Street | Huntington Park | 1936 | 2 | 1 | 1,098 | 5,401 | $582 | $639,000 | 9 | 83 |
| 6033 Clarkson | Maywood | 1927 | 3 | 2 | 1,124 | 6,340 | $711 | $799,000 | 9 | 81 |
| 4840 Brompton | Bell Gardens | 1941 | 3 | 2 | 1,291 | 5,701 | $581 | $749,999 | 9 | 80 |
| 4027 Santa Ana | Huntington Park | 1940 | 2 | 1 | 1,064 | 6,125 | $634 | $675,000 | 17 | 79 |
| Total: 5 · Average | 2.4 | 1.4 | 1,092.2 | 5,632.8 | $666.6 | $718,399.8 | 9.8 | |||
| Median | 1,098 | $729,000 | ||||||||
Closed Properties (5)
Closed Comparables
| Address | City | Year | Date | BD | BTH | SqFt | LotSz | LP | SP | SP/SqFt | SP/LP | DIM | Score |
|---|---|---|---|---|---|---|---|---|---|---|---|---|---|
| 4020 61st | Huntington Park | 1940 | 05/20/2026 | 3 | 2 | 1,275 | 5,036 | $750,000 | $740,000 | $580 | 0.99 | 56 | 86 |
| 4361 56th | Maywood | 1946 | 08/20/2026 | 3 | 2 | 1,414 | 4,535 | $660,000 | $660,000 | $467 | 1.00 | 63 | 85 |
| 5712 Fishburn | Maywood | 1936 | 01/20/2026 | 3 | 2 | 1,188 | 5,036 | $737,777 | $725,000 | $610 | 0.98 | 85 | 83 |
| 6072 Gifford | Huntington Park | 1923 | 05/06/2026 | 3 | 1 | 1,116 | 4,771 | $674,900 | $675,000 | $605 | 1.00 | 28 | 82 |
| 4339 58th Street | Maywood | 1938 | 11/28/2025 | 3 | 2 | 1,356 | 6,443 | $720,000 | $720,000 | $531 | 1.00 | 102 | 80 |
| Total: 5 · Average | 3.0 | 1.8 | 1,269.8 | 5,164.2 | $704,000 | $704,000 | $558.6 | — | 66.8 | ||||
| Median | 1,275 | $720,000 | $720,000 | ||||||||||
Market Analysis
List vs Sale $/SqFt
Sale Price Trend
Days on Market
Sale vs List Price
This analysis was generated automatically from MLS data. For an in-depth, human-reviewed valuation, contact Joseph Sardella at josephsardella@gmail.com.