1 / 1
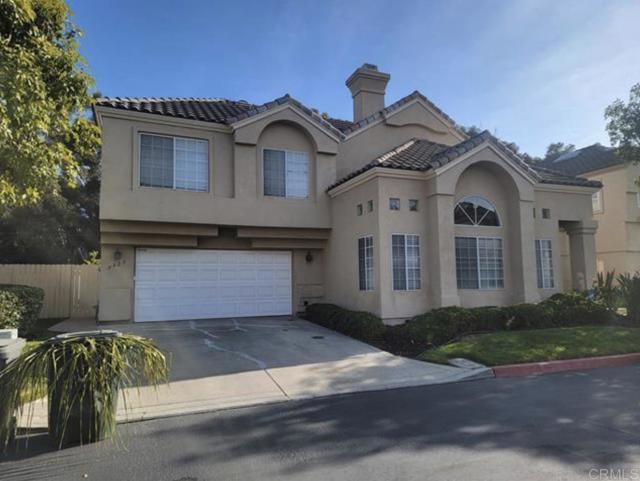
3925 Kaplan Way, National City, CA 91950
$749K4bd · 3ba · 2,174 sqft
Lot 77,320 sqft•HOA $310/mo•Single Family Residence•Active•19d on market•MLS# 8P-2607733
3925 Kaplan Way, National City, CA 91950
MLS# 8P-2607733•Residential•Single Family Residence
Active19 days on market
$749,000
4
Beds
3
Baths
2,174
Sq Ft
77,320
Lot Sq Ft
$310
HOA/mo
1993
Year Built
None
View
Property Description
This two-story home features 4 bedrooms and 2.5 bathrooms. It is conveniently located near major freeways, shopping, and dining in a desirable neighborhood.
Features & Amenities
FeeBuilt 1993
Property Details
Land Type
Fee
Year Built
1993
Property Type
Residential
Property Subtype
Single Family Residence
Parking Spaces
4
Garage Spaces
2
Cooling
Central Air
View
None
City
National City
Zip Code
91950
County
San Diego
Mortgage Calculator
Current Rates
$
$
%
Monthly Payment
$3,787.35
Principal & Interest
Loan Amount
$599,200
Total Interest
$764,247
Total Payment Over 30 Years
$1,363,447
This calculator provides estimates only. Actual mortgage payments may include taxes, insurance, HOA fees, and PMI. Contact a lender for accurate quotes.
Comparative Market Analysis
Residential Tier · 5 active · 5 closed
3925 Kaplan Way, National City, CA 91950
National City · Single Family Residence
$749K
Residential TierBeds
4
Baths
3
Sqft
2,174
Lot
1.78 ac
Year
1993
$/Sqft
$345
Pool: No✓
Spa: No✓
View: None✓
Garage: 2-car✓
Listed in line with the median closed sale of $770,000. Price per sqft ($345) is a 22% discount to closed comps ($440).
Price Position
Aligned with the market — fair pricing for the comps.
At market
Subject listed at $749K· $345/sqft
Total list price
Closed comps
vs closed median $770K
−$21K (−2.7%)
Active comps
vs active median $800K
−$51K (−6.3%)
Price per sqft
Closed compsinsufficient comp data
Active comps
vs active avg $/sqft $469
−$124 (−26.4%)
Active Properties (5)
Active Comparables
| Address | City | Year | BD | BTH | SqFt | LotSz | LP/SqFt | LP | DIM | Score |
|---|---|---|---|---|---|---|---|---|---|---|
| 6187 Parkside Avenue | San Diego | 1972 | 4 | 2 | 1,844 | 4,800 | $466 | $859,000 | 17 | 77 |
| 5949 Tonawanda Drive | San Diego | 1979 | 3 | 2 | 1,568 | 5,486 | $478 | $750,000 | 73 | 73 |
| 2860 Carmar Way | San Diego | 1971 | 4 | 3 | 1,668 | 4,792 | $510 | $849,999 | 40 | 72 |
| 3522 Newberry Street | National City | 1962 | 5 | 2 | 1,660 | 5,800 | $458 | $759,900 | 2 | 72 |
| 389 First Avenue | Chula Vista | 1972 | 3 | 3 | 1,852 | 7,700 | $432 | $799,500 | 52 | 67 |
| Total: 5 · Average | 3.8 | 2.4 | 1,718.4 | 5,715.6 | $468.8 | $803,679.8 | 36.8 | |||
| Median | 1,668 | $799,500 | ||||||||
Closed Properties (5)
Closed Comparables
| Address | City | Year | Date | BD | BTH | SqFt | LotSz | LP | SP | SP/SqFt | SP/LP | DIM | Score |
|---|---|---|---|---|---|---|---|---|---|---|---|---|---|
| 5561 Chattanooga Street | San Diego | 1969 | 10/01/2026 | 5 | 3 | 2,022 | 0 | $699,000 | $645,000 | $319 | 0.92 | 92 | 83 |
| 3047 Fleming Drive | San Diego | 1973 | 05/15/2026 | 4 | 3 | 1,844 | 4,356 | $839,000 | $839,000 | $455 | 1.00 | 90 | 77 |
| 3416 Paseo de Fuentes | National City | 2006 | 12/12/2025 | 3 | 3 | 1,463 | 32,600 | $740,000 | $732,500 | $501 | 0.99 | 57 | 75 |
| 2971 Manos Drive | San Diego | 1977 | 10/02/2026 | 4 | 2 | 1,636 | 5,900 | $770,000 | $770,000 | $471 | 1.00 | 72 | 74 |
| 3213 Jacob ct | National City | 2007 | 07/01/2026 | 4 | 3 | 1,748 | 181,000 | $779,900 | $790,000 | $452 | 1.01 | 40 | 73 |
| Total: 5 · Average | 4.0 | 2.8 | 1,742.6 | 55,964 | $755,300 | $755,300 | $439.6 | — | 70.2 | ||||
| Median | 1,748 | $770,000 | $770,000 | ||||||||||
Market Analysis
List vs Sale $/SqFt
Sale Price Trend
Days on Market
Sale vs List Price
AI-generated CMA
This analysis was generated automatically from MLS data. For an in-depth, human-reviewed valuation, contact Joseph Sardella at josephsardella@gmail.com.