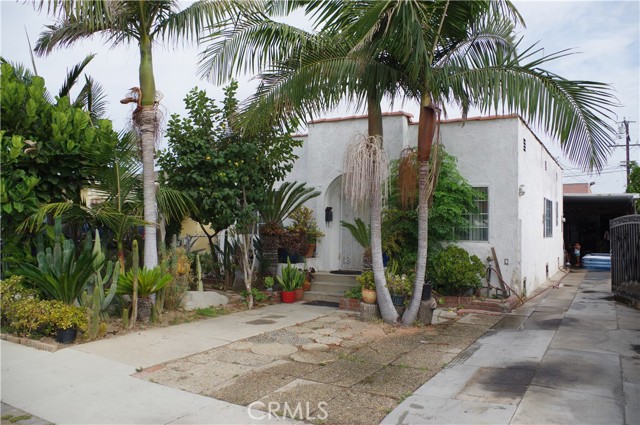
3855 West 115th, Hawthorne, CA 90250
3855 West 115th, Hawthorne, CA 90250
Property Description
This 2-bedroom, 1-bathroom home offers approximately 936 square feet of living space on a 5,998 square foot lot. Originally built in 1924, the residence features the charm and proportions of a classic Southern California home. The property includes a backyard with patio space and mature fruit trees. The generous lot also offers additional possibilities for future improvements or customization. Conveniently located in Hawthorne, the home is near shopping, dining, transportation, and major South Bay destinations, including the Intuit Dome and SoFi Stadium. With its central location, outdoor space, and classic character, this property offers an appealing opportunity for homeowners or investors.
Features & Amenities
Property Details
Mortgage Calculator
Current Rates
Comparative Market Analysis
Affordable Tier · 5 active · 5 closed
Hawthorne · Single Family Residence
Listed 6.0% below the median closed sale of $850,000. Price per sqft ($854) is a 21% premium to closed comps ($706). Closed comps sold at 101% of list — strong seller's market.
Price Position
Priced below the market — value advantage over the field.
Active Properties (5)
Active Comparables
| Address | City | Year | BD | BTH | SqFt | LotSz | LP/SqFt | LP | DIM | Score |
|---|---|---|---|---|---|---|---|---|---|---|
| 3735 117th | Hawthorne | 1940 | 3 | 1 | 1,157 | 7,572 | $605 | $699,999 | 6 | 83 |
| 3612 113th | Inglewood | 1942 | 3 | 2 | 1,370 | 6,029 | $577 | $790,000 | 73 | 75 |
| 11125 Osage Avenue | Inglewood | 1922 | 3 | 2 | 1,441 | 7,293 | $554 | $799,000 | 123 | 71 |
| 11111 Osage | Inglewood | 1964 | 4 | 2 | 1,348 | 5,245 | $553 | $745,000 | 107 | 68 |
| 3731 118th | Hawthorne | 1940 | 4 | 3 | 1,937 | 7,380 | $464 | $899,000 | 11 | 56 |
| Total: 5 · Average | 3.4 | 2.0 | 1,450.6 | 6,703.8 | $550.6 | $786,599.8 | 64 | |||
| Median | 1,370 | $790,000 | ||||||||
Closed Properties (5)
Closed Comparables
| Address | City | Year | Date | BD | BTH | SqFt | LotSz | LP | SP | SP/SqFt | SP/LP | DIM | Score |
|---|---|---|---|---|---|---|---|---|---|---|---|---|---|
| 3907 109th Street | Inglewood | 1923 | 07/27/2026 | 3 | 1 | 766 | 9,030 | $850,000 | $850,000 | $1,110 | 1.00 | 146 | 83 |
| 11916 Oxford Avenue | Hawthorne | 1925 | 04/29/2026 | 3 | 2 | 1,356 | 5,525 | $819,000 | $875,000 | $645 | 1.07 | 35 | 75 |
| 4115 111th Street | Inglewood | 1927 | 12/29/2025 | 3 | 2 | 1,411 | 6,045 | $819,000 | $820,000 | $581 | 1.00 | 85 | 71 |
| 3929 W. 119th Pl | Hawthorne | 1960 | 05/08/2026 | 3 | 2 | 1,234 | 5,998 | $869,000 | $860,000 | $697 | 0.99 | 77 | 71 |
| 3841 113TH | Inglewood | 1978 | 04/03/2026 | 3 | 2 | 1,450 | 6,020 | $725,000 | $720,000 | $497 | 0.99 | 79 | 69 |
| Total: 5 · Average | 3.0 | 1.8 | 1,243.4 | 6,523.6 | $825,000 | $825,000 | $706 | — | 84.4 | ||||
| Median | 1,356 | $850,000 | $850,000 | ||||||||||
Market Analysis
List vs Sale $/SqFt
Sale Price Trend
Days on Market
Sale vs List Price
This analysis was generated automatically from MLS data. For an in-depth, human-reviewed valuation, contact Joseph Sardella at josephsardella@gmail.com.