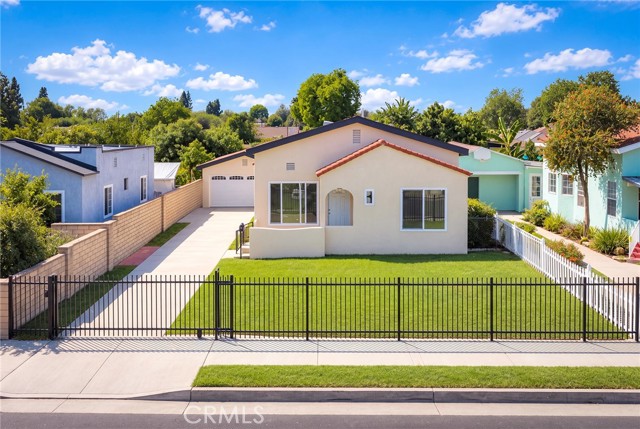
3829 Clark Avenue, El Monte, CA 91731
3829 Clark Avenue, El Monte, CA 91731
Property Description
Welcome to 3829 Clark Avenue, a thoughtfully updated single-story home in El Monte offering 3 bedrooms, 2 bathrooms, and approximately 1,032 square feet of living space. The interior features updated flooring, a remodeled kitchen and bathrooms, refreshed finishes, and wall-mounted air conditioning units for added comfort. A detached two-car garage and a generous lot provide space for parking, outdoor enjoyment, and everyday convenience. Explore the possibilities for future improvements or an accessory dwelling unit, subject to city approval and buyer verification of applicable requirements. Conveniently located in the San Gabriel Valley, this home combines an updated interior with versatile outdoor space.
Features & Amenities
Property Details
Mortgage Calculator
Current Rates
Comparative Market Analysis
Affordable Tier · 5 active · 5 closed
El Monte · Single Family Residence
Listed 3.6% below the median closed sale of $858,536. Price per sqft ($802) is a 66% premium to closed comps ($483). Closed comps sold at 102% of list — strong seller's market. Expect a longer timeline — comps averaged 137 days on market.
Price Position
Aligned with the market — fair pricing for the comps.
Active Properties (5)
Active Comparables
| Address | City | Year | BD | BTH | SqFt | LotSz | LP/SqFt | LP | DIM | Score |
|---|---|---|---|---|---|---|---|---|---|---|
| 10966 Emery | El Monte | 1953 | 3 | 2 | 1,020 | 5,523 | $750 | $765,000 | 13 | 86 |
| 4403 Cedar Ave | El Monte | 1920 | 3 | 1 | 1,134 | 4,991 | $643 | $729,000 | 89 | 80 |
| 11427 Mulhall | El Monte | 1949 | 3 | 3 | 1,361 | 8,692 | $683 | $930,000 | 12 | 73 |
| 4011 Cedar Avenue | El Monte | 1950 | 3 | 4 | 1,831 | 10,335 | $491 | $899,000 | 81 | 63 |
| 11415 Wildrose Lane | El Monte | 2026 | 4 | 4 | 1,998 | 1,998 | $405 | $808,880 | 8 | 54 |
| Total: 5 · Average | 3.2 | 2.8 | 1,468.8 | 6,307.8 | $594.4 | $826,376 | 40.6 | |||
| Median | 1,361 | $808,880 | ||||||||
Closed Properties (5)
Closed Comparables
| Address | City | Year | Date | BD | BTH | SqFt | LotSz | LP | SP | SP/SqFt | SP/LP | DIM | Score |
|---|---|---|---|---|---|---|---|---|---|---|---|---|---|
| 11161 Basye | El Monte | 1953 | 10/06/2026 | 3 | 2 | 1,200 | 8,497 | $695,000 | $750,000 | $625 | 1.08 | 45 | 84 |
| 11308 Forest Grove | El Monte | 1954 | 01/16/2026 | 3 | 2 | 1,839 | 7,567 | $938,000 | $920,000 | $500 | 0.98 | 43 | 63 |
| 11442 Clover Lane | El Monte | 2026 | 09/29/2026 | 4 | 4 | 1,998 | 1,998 | $847,490 | $856,930 | $429 | 1.01 | 302 | 53 |
| 11444 Clover Lane | El Monte | 2026 | 09/30/2026 | 4 | 4 | 1,998 | 1,282 | $839,490 | $858,536 | $430 | 1.02 | 258 | 53 |
| 11454 Clover Lane | El Monte | 2026 | 08/21/2026 | 4 | 4 | 1,998 | 1,998 | $875,000 | $865,000 | $433 | 0.99 | 36 | 52 |
| Total: 5 · Average | 3.6 | 3.2 | 1,806.6 | 4,268.4 | $850,093.2 | $850,093.2 | $483.4 | — | 136.8 | ||||
| Median | 1,998 | $858,536 | $858,536 | ||||||||||
Market Analysis
List vs Sale $/SqFt
Sale Price Trend
Days on Market
Sale vs List Price
This analysis was generated automatically from MLS data. For an in-depth, human-reviewed valuation, contact Joseph Sardella at josephsardella@gmail.com.