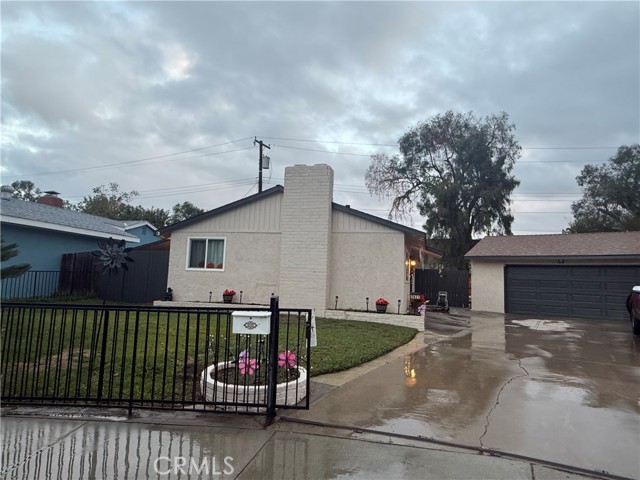
3821 Carthage Street, Riverside, CA 92501
3821 Carthage Street, Riverside, CA 92501
Property Description
SINGLE STORY, very nice house with INGROUND SPARKLING POO, corner lot, HUGE BACK YARD, 4br 2ba, detached 2 CAR GARAGE, new roof, new laminated flooring, recently painted. nice and quiet area close to MAYOR HIGHWAYS, and public transportation, UC Riverside, Riverside Community College, CENTRAL AIR, force heating, cozy living room, fireplace in family room, minutes to Downtown Riverside, walking distance to Fairmont Park and Lake Evans
Features & Amenities
Property Details
Mortgage Calculator
Current Rates
Comparative Market Analysis
Affordable Tier · 5 active · 5 closed
Riverside · Single Family Residence
Listed in line with the median closed sale of $592,000. Closed comps sold at 101% of list — strong seller's market.
Price Position
Aligned with the market — fair pricing for the comps.
Active Properties (5)
Active Comparables
| Address | City | Year | BD | BTH | SqFt | LotSz | LP/SqFt | LP | DIM | Score |
|---|---|---|---|---|---|---|---|---|---|---|
| 2868 Locust | Riverside | 1950 | 3 | 1 | 1,040 | 7,405 | $562 | $585,000 | 5 | 78 |
| 3432 Russell | Riverside | 1946 | 3 | 1 | 1,240 | 6,534 | $484 | $599,900 | 145 | 75 |
| 3943 Ridge Road | Riverside | 1924 | 3 | 2 | 1,436 | 6,098 | $393 | $565,000 | 422 | 65 |
| 4032 Alicia Court | Riverside | 2007 | 4 | 3 | 1,880 | 2,614 | $308 | $579,900 | 90 | 59 |
| 1766 Park Place | Riverside | 2023 | 3 | 3 | 1,829 | 2,770 | $320 | $585,000 | 156 | 57 |
| Total: 5 · Average | 3.2 | 2.0 | 1,485 | 5,084.2 | $413.4 | $582,960 | 163.6 | |||
| Median | 1,436 | $585,000 | ||||||||
Closed Properties (5)
Closed Comparables
| Address | City | Year | Date | BD | BTH | SqFt | LotSz | LP | SP | SP/SqFt | SP/LP | DIM | Score |
|---|---|---|---|---|---|---|---|---|---|---|---|---|---|
| 3818 Ogden Way | Riverside | 1956 | 08/14/2026 | 3 | 2 | 1,075 | 7,841 | $508,500 | $515,000 | $479 | 1.01 | 52 | 86 |
| 3855 Stansell | Riverside | 1952 | 05/28/2026 | 3 | 1 | 1,092 | 9,148 | $575,000 | $600,000 | $549 | 1.04 | 42 | 85 |
| 3869 Shamrock | Riverside | 1952 | 06/29/2026 | 3 | 3 | 1,097 | 11,326 | $549,000 | $592,000 | $540 | 1.08 | 45 | 82 |
| 1650 Orange | Riverside | 1964 | 04/13/2026 | 3 | 2 | 1,152 | 7,405 | $560,000 | $535,000 | $464 | 0.95 | 91 | 80 |
| 2715 Brockton | Riverside | 1972 | 09/18/2026 | 4 | 2 | 1,401 | 12,632 | $640,000 | $610,000 | $435 | 0.95 | 119 | 78 |
| Total: 5 · Average | 3.2 | 2.0 | 1,163.4 | 9,670.4 | $570,400 | $570,400 | $493.4 | — | 69.8 | ||||
| Median | 1,097 | $592,000 | $592,000 | ||||||||||
Market Analysis
List vs Sale $/SqFt
Sale Price Trend
Days on Market
Sale vs List Price
This analysis was generated automatically from MLS data. For an in-depth, human-reviewed valuation, contact Joseph Sardella at josephsardella@gmail.com.