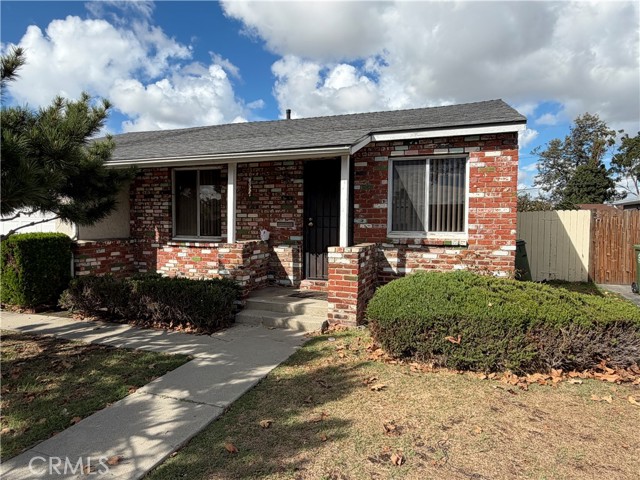
3735 West 117th, Hawthorne, CA 90250
3735 West 117th, Hawthorne, CA 90250
Property Description
One of the best priced homes in all of Hawthorne! This is a 3 bedroom, 1 bath home currently being used as a 2 bedroom. The owner removed a couple of walls to create a larger living room area, perfect for entertaining, but the home can potentially be converted back to a 3 bedroom layout. The home is mostly original, is sitting on a huge HAR2 lot, and does need some TLC. So bring your paintbrush! The property does have a newer roof and newer plumbing in the kitchen area. The property is being sold as-is, so bring your best offers!
Features & Amenities
Property Details
Mortgage Calculator
Current Rates
Comparative Market Analysis
Affordable Tier · 5 active · 5 closed
Hawthorne · Single Family Residence
Listed 3.7% above the median closed sale of $675,000.
Price Position
Aligned with the market — fair pricing for the comps.
Active Properties (5)
Active Comparables
| Address | City | Year | BD | BTH | SqFt | LotSz | LP/SqFt | LP | DIM | Score |
|---|---|---|---|---|---|---|---|---|---|---|
| 3612 113th | Inglewood | 1942 | 3 | 2 | 1,370 | 6,029 | $577 | $790,000 | 73 | 85 |
| 3855 115th | Hawthorne | 1924 | 2 | 1 | 936 | 5,998 | $854 | $799,000 | 1 | 83 |
| 4134 107th | Inglewood | 1925 | 3 | 2 | 1,143 | 4,166 | $661 | $755,000 | 66 | 80 |
| 12247 Cedar Avenue | Hawthorne | 1951 | 2 | 1 | 842 | 3,191 | $890 | $749,000 | 5 | 76 |
| 11125 Osage Avenue | Inglewood | 1922 | 3 | 2 | 1,441 | 7,293 | $554 | $799,000 | 123 | 75 |
| Total: 5 · Average | 2.6 | 1.6 | 1,146.4 | 5,335.4 | $707.2 | $778,400 | 53.6 | |||
| Median | 1,143 | $790,000 | ||||||||
Closed Properties (5)
Closed Comparables
| Address | City | Year | Date | BD | BTH | SqFt | LotSz | LP | SP | SP/SqFt | SP/LP | DIM | Score |
|---|---|---|---|---|---|---|---|---|---|---|---|---|---|
| 3341 118th Street | Inglewood | 1947 | 12/01/2025 | 3 | 1 | 1,188 | 6,326 | $699,000 | $640,000 | $539 | 0.92 | 80 | 83 |
| 3336 118th Place | Inglewood | 1947 | 01/22/2026 | 3 | 2 | 1,264 | 6,683 | $740,000 | $755,000 | $597 | 1.02 | 62 | 81 |
| 3519 117th Street | Inglewood | 1939 | 09/24/2026 | 2 | 1 | 780 | 7,565 | $669,000 | $675,000 | $865 | 1.01 | 37 | 81 |
| 11835 Oxford Avenue | Hawthorne | 1944 | 07/09/2026 | 2 | 1 | 808 | 6,579 | $669,000 | $610,000 | $755 | 0.91 | 138 | 80 |
| 3830 118th Street | Hawthorne | 1956 | 12/29/2025 | 4 | 2 | 1,214 | 5,821 | $759,000 | $730,000 | $601 | 0.96 | 280 | 77 |
| Total: 5 · Average | 2.8 | 1.4 | 1,050.8 | 6,594.8 | $682,000 | $682,000 | $671.4 | — | 119.4 | ||||
| Median | 1,188 | $675,000 | $675,000 | ||||||||||
Market Analysis
List vs Sale $/SqFt
Sale Price Trend
Days on Market
Sale vs List Price
This analysis was generated automatically from MLS data. For an in-depth, human-reviewed valuation, contact Joseph Sardella at josephsardella@gmail.com.