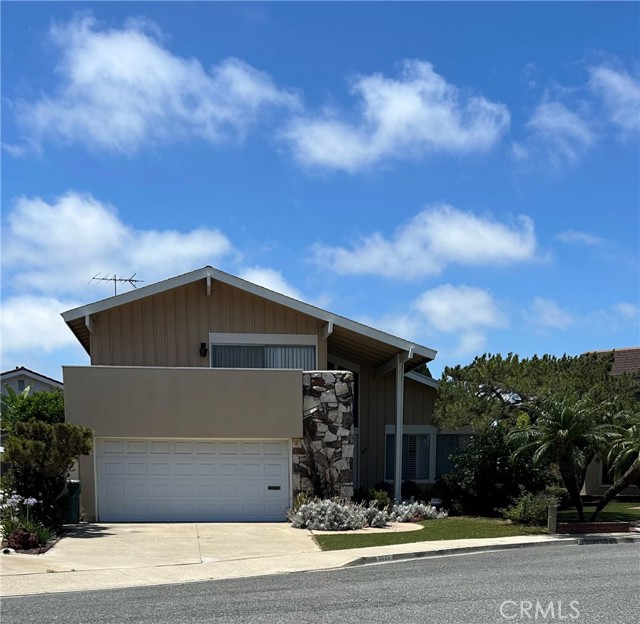
3621 Teaberry Circle, Seal Beach, CA 90740
3621 Teaberry Circle, Seal Beach, CA 90740
Property Description
Rare opportunity in the highly sought-after College Park East area of Seal Beach! Situated on a cul-de-sac, this spacious tri-level home offers a versatile 4-bedroom, 3-bath floor plan with a living room, kitchen, and dining area on the main level, three bedrooms upstairs, and a lower level featuring a generous family room and separate bedroom. Ready for updating, this property presents an exceptional chance to add value, build equity, and create a home tailored to your personal style. Bring your vision and unlock the tremendous potential of this well-located Seal Beach residence. Buyer is responsible to satisfy themselves as to the square footage represented. Square footage auto-populated from public records.
Features & Amenities
Property Details
Mortgage Calculator
Current Rates
About College Park East
This property is located in College Park East, a community in Seal Beach. Explore more listings in this neighborhood to compare options and pricing.
View College Park East ListingsComparative Market Analysis
Residential Tier · 5 active · 5 closed
College Park East · Seal Beach · Single Family Residence
Listed 5.3% above the median closed sale of $1,325,000. Price per sqft ($549) is a 21% discount to closed comps ($694).
Price Position
Positioned above the market — commands a premium.
Active Properties (5)
Active Comparables
| Address | City | Year | BD | BTH | SqFt | LotSz | LP/SqFt | LP | DIM | Score |
|---|---|---|---|---|---|---|---|---|---|---|
| 4665 Guava Avenue | Seal Beach | 1967 | 4 | 3 | 2,065 | 5,478 | $726 | $1.50M | 23 | 84 |
| 5021 Apollo Circle | Los Alamitos | 1970 | 4 | 3 | 2,197 | 2,590 | $603 | $1.32M | 15 | 67 |
| 5398 Park Avenue | Garden Grove | 1964 | 4 | 3 | 2,034 | 7,210 | $707 | $1.44M | 39 | 65 |
| 4549 Birchwood | Seal Beach | 1968 | 4 | 2 | 1,914 | 5,200 | $741 | $1.42M | 251 | 65 |
| 5362 Acacia Avenue | Garden Grove | 1965 | 4 | 2 | 1,430 | 6,000 | $908 | $1.30M | 15 | 62 |
| Total: 5 · Average | 4.0 | 2.6 | 1,928 | 5,295.6 | $737 | $1.40M | 68.6 | |||
| Median | 2,034 | $1.42M | ||||||||
Closed Properties (5)
Closed Comparables
| Address | City | Year | Date | BD | BTH | SqFt | LotSz | LP | SP | SP/SqFt | SP/LP | DIM | Score |
|---|---|---|---|---|---|---|---|---|---|---|---|---|---|
| 4765 Ironwood Avenue | Seal Beach | 1966 | 12/17/2025 | 4 | 3 | 2,120 | 5,200 | $1.30M | $1.24M | $585 | 0.95 | 93 | 89 |
| 3580 Teaberry | Seal Beach | 1970 | 10/05/2026 | 4 | 3 | 2,791 | 5,200 | $1.63M | $1.52M | $546 | 0.94 | 60 | 87 |
| 3930 Rose | Seal Beach | 1968 | 10/01/2026 | 4 | 2 | 1,524 | 5,200 | $1.40M | $1.40M | $919 | 1.00 | 22 | 87 |
| 4657 Hazelnut Avenue | Seal Beach | 1966 | 06/22/2026 | 4 | 2 | 1,645 | 5,800 | $1.32M | $1.32M | $805 | 1.00 | 54 | 85 |
| 4501 Fir | Seal Beach | 1968 | 12/24/2025 | 4 | 2 | 2,016 | 5,200 | $1.30M | $1.24M | $613 | 0.95 | 19 | 85 |
| Total: 5 · Average | 4.0 | 2.4 | 2,019.2 | 5,320 | $1.34M | $1.34M | $693.6 | — | 49.6 | ||||
| Median | 2,016 | $1.32M | $1.32M | ||||||||||
Market Analysis
List vs Sale $/SqFt
Sale Price Trend
Days on Market
Sale vs List Price
This analysis was generated automatically from MLS data. For an in-depth, human-reviewed valuation, contact Joseph Sardella at josephsardella@gmail.com.