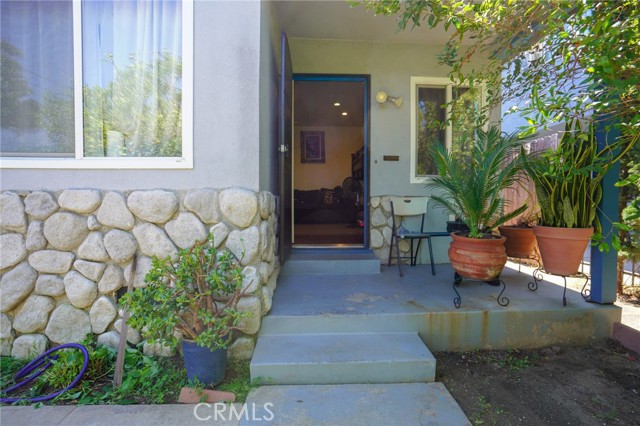
3612 West 113th, Inglewood, CA 90303
3612 West 113th, Inglewood, CA 90303
Property Description
Charming 3-Bedroom, 2-Bath Home with Detached Garage & ADU Potential in Prime Inglewood Location! Welcome to 3612 W 113th St, a charming 3-bedroom, 2-bathroom home offering approximately 1,370 sq. ft. of living space on a 6,029 sq. ft. lot, according to public records. This property offers a wonderful combination of comfortable living space, a spacious lot, and exciting potential for the future. The home features a cozy fireplace, inviting living areas, and a detached garage. The generously sized backyard is highlighted by multiple mature fruit trees, creating a peaceful outdoor setting perfect for relaxing, entertaining, gardening, or enjoying fresh fruit. The spacious lot also provides potential for an ADU or additional living space, subject to buyer verification with the City of Inglewood and applicable zoning and permitting requirements. This creates an exciting opportunity for homeowners, extended family, or investors looking to maximize the property's potential. Location, Location, Location! Situated just east of Prairie Avenue and south of Century Boulevard, this home is ideally positioned near some of Southern California's premier sports, entertainment, and concert destinations. Enjoy being minutes from SoFi Stadium, Intuit Dome, the Kia Forum, LAX, shopping, restaurants, and major freeways. And when you're ready for a day at the beach, the Pacific Ocean and South Bay beaches are just a short drive away. This is an exceptional opportunity to own a home in one of Inglewood's most exciting and rapidly developing areas. 3 Bedrooms | 2 Bathrooms | Approx. 1,370 Sq. Ft. | Approx. 6,029 Sq. Ft. Lot | Fireplace | Detached Garage | Mature Fruit Trees | Possible ADU Potential | Prime Inglewood Location Don't miss this opportunity to own a home with character, a spacious lot, detached garage, fruit trees, and tremendous future potential—all in an outstanding location close to sports, entertainment, LAX, and the beach! Buyer to independently verify square footage, lot size, zoning, ADU potential, permits, and all property information to their satisfaction.
Features & Amenities
Property Details
Mortgage Calculator
Current Rates
Comparative Market Analysis
Affordable Tier · 5 active · 5 closed
Inglewood · Single Family Residence
Listed 4.6% above the median closed sale of $755,000.
Price Position
Aligned with the market — fair pricing for the comps.
Active Properties (5)
Active Comparables
| Address | City | Year | BD | BTH | SqFt | LotSz | LP/SqFt | LP | DIM | Score |
|---|---|---|---|---|---|---|---|---|---|---|
| 11804 Wilkie | Hawthorne | 1954 | 3 | 2 | 1,401 | 5,102 | $607 | $849,900 | 79 | 88 |
| 3735 117th | Hawthorne | 1940 | 3 | 1 | 1,157 | 7,572 | $605 | $699,999 | 6 | 88 |
| 11111 Osage | Inglewood | 1964 | 4 | 2 | 1,348 | 5,245 | $553 | $745,000 | 107 | 84 |
| 10513 5th | Inglewood | 1954 | 3 | 2 | 1,554 | 6,907 | $483 | $750,000 | 149 | 83 |
| 4134 107th | Inglewood | 1925 | 3 | 2 | 1,143 | 4,166 | $661 | $755,000 | 66 | 82 |
| Total: 5 · Average | 3.2 | 1.8 | 1,320.6 | 5,798.4 | $581.8 | $759,979.8 | 81.4 | |||
| Median | 1,348 | $750,000 | ||||||||
Closed Properties (5)
Closed Comparables
| Address | City | Year | Date | BD | BTH | SqFt | LotSz | LP | SP | SP/SqFt | SP/LP | DIM | Score |
|---|---|---|---|---|---|---|---|---|---|---|---|---|---|
| 3336 118th Place | Inglewood | 1947 | 01/22/2026 | 3 | 2 | 1,264 | 6,683 | $740,000 | $755,000 | $597 | 1.02 | 62 | 86 |
| 3221 113th Street | Inglewood | 1950 | 08/19/2026 | 3 | 1 | 1,089 | 6,032 | $749,000 | $749,000 | $688 | 1.00 | 20 | 86 |
| 3841 113TH | Inglewood | 1978 | 04/03/2026 | 3 | 2 | 1,450 | 6,020 | $725,000 | $720,000 | $497 | 0.99 | 79 | 85 |
| 3511 118th Place | Inglewood | 1939 | 05/28/2026 | 3 | 2 | 1,680 | 7,377 | $799,000 | $790,000 | $470 | 0.99 | 10 | 85 |
| 3848 112th | Inglewood | 1947 | 12/05/2025 | 3 | 3 | 1,467 | 5,423 | $770,000 | $770,000 | $525 | 1.00 | 50 | 84 |
| Total: 5 · Average | 3.0 | 2.0 | 1,390 | 6,307 | $756,800 | $756,800 | $555.4 | — | 44.2 | ||||
| Median | 1,450 | $755,000 | $755,000 | ||||||||||
Market Analysis
List vs Sale $/SqFt
Sale Price Trend
Days on Market
Sale vs List Price
This analysis was generated automatically from MLS data. For an in-depth, human-reviewed valuation, contact Joseph Sardella at josephsardella@gmail.com.