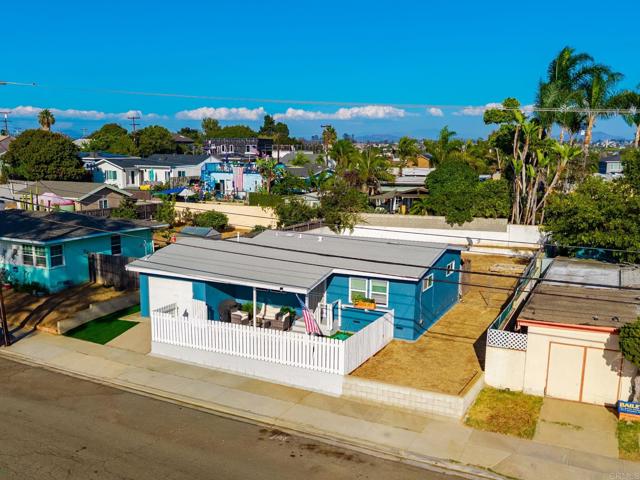
3575 Waco Street, San Diego, CA 92117
3575 Waco Street, San Diego, CA 92117
Property Description
Bay Park development opportunity across from a neighborhood park! Enjoy the neighborhood’s mix of local restaurants and cafés, with Mission Bay, Tecolote Canyon trails, and the coast nearby. The property currently has an approximately 806 sq. ft. two-bedroom home. The seller has stamped plans for four proposed rear ADUs, each designed with two bedrooms and one bathroom. The proposed second-floor ADUs will have peekaboo ocean views; buyer to verify views from the completed units. Plans and project documents are available for review.
Features & Amenities
Property Details
Mortgage Calculator
Current Rates
Comparative Market Analysis
Affordable Tier · 5 active · 5 closed
San Diego · Single Family Residence
Listed in line with the median closed sale of $1,220,000. Price per sqft ($1,551) is a 58% premium to closed comps ($982). Closed comps sold at 102% of list — strong seller's market.
Price Position
Aligned with the market — fair pricing for the comps.
Active Properties (5)
Active Comparables
| Address | City | Year | BD | BTH | SqFt | LotSz | LP/SqFt | LP | DIM | Score |
|---|---|---|---|---|---|---|---|---|---|---|
| 3620 Cowley Way | San Diego | 1953 | 4 | 2 | 1,324 | 6,098 | $819 | $1.08M | 92 | 71 |
| 4329 Mount Henry Avenue | Clairemont Mesa | 1959 | 3 | 2 | 1,176 | 6,900 | $1,178 | $1.39M | 5 | 65 |
| 4311 Tecumseh Way | San Diego | 1958 | 4 | 2 | 1,159 | 7,000 | $949 | $1.10M | 37 | 64 |
| 4840 Diane Avenue | San Diego | 1961 | 3 | 2 | 1,118 | 6,800 | $962 | $1.07M | 32 | 63 |
| 4121 Mount Hukee | San Diego | 1961 | 4 | 2 | 1,426 | 6,066 | $876 | $1.25M | 16 | 62 |
| Total: 5 · Average | 3.6 | 2.0 | 1,240.6 | 6,572.8 | $956.8 | $1.18M | 36.4 | |||
| Median | 1,176 | $1.10M | ||||||||
Closed Properties (5)
Closed Comparables
| Address | City | Year | Date | BD | BTH | SqFt | LotSz | LP | SP | SP/SqFt | SP/LP | DIM | Score |
|---|---|---|---|---|---|---|---|---|---|---|---|---|---|
| 3317 Mohican | San Diego | 1953 | 09/25/2026 | 3 | 1 | 904 | 6,970 | $1.06M | $1.07M | $1,189 | 1.01 | 53 | 88 |
| 3561 Tomahawk Lane | San Diego | 1954 | 08/31/2026 | 3 | 2 | 1,410 | 6,200 | $1.18M | $1.16M | $823 | 0.99 | 108 | 73 |
| 5565 Mount Aconia Way | San Diego | 1964 | 10/29/2026 | 3 | 2 | 1,288 | 6,200 | $1.20M | $1.22M | $947 | 1.02 | 21 | 67 |
| 3527 Moultrie Avenue | San Diego | 1956 | 06/22/2026 | 3 | 2 | 1,375 | 6,300 | $1.35M | $1.41M | $1,022 | 1.04 | 29 | 66 |
| 4259 Mount Henry | San Diego | 1960 | 06/08/2026 | 3 | 2 | 1,352 | 6,300 | $1.23M | $1.25M | $928 | 1.02 | 25 | 63 |
| Total: 5 · Average | 3.0 | 1.8 | 1,265.8 | 6,394 | $1.22M | $1.22M | $981.8 | — | 47.2 | ||||
| Median | 1,352 | $1.22M | $1.22M | ||||||||||
Market Analysis
List vs Sale $/SqFt
Sale Price Trend
Days on Market
Sale vs List Price
This analysis was generated automatically from MLS data. For an in-depth, human-reviewed valuation, contact Joseph Sardella at josephsardella@gmail.com.