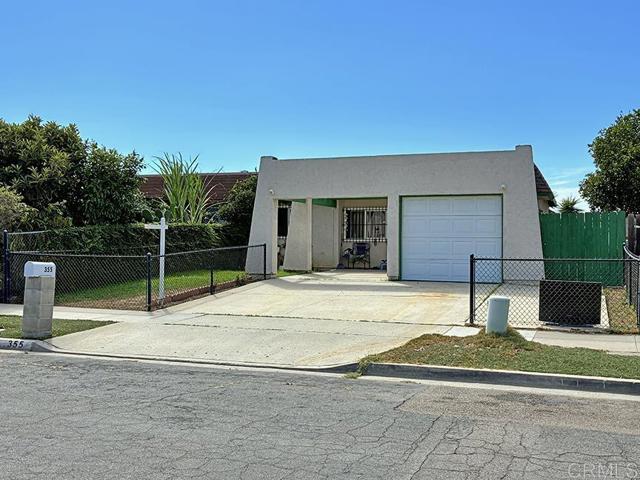
355 Calle Mariposa, Oceanside, CA 92057
355 Calle Mariposa, Oceanside, CA 92057
Property Description
Welcome to your 3 bed/2 bath, 1055 sq ft. home in Oceanside. Convenient location near parks, bike trail, shopping, major road access, and less then six miles to the Oceanside Pier! Past updates include cabinetry in the kitchen and bathrooms, tub insert in secondary bathroom, plumbing, windows and roof. Lemon and orange tree in the backyard. Security screen front door and a sliding door from the living room to the ample concrete side yard.
Features & Amenities
Property Details
Mortgage Calculator
Current Rates
Comparative Market Analysis
Affordable Tier · 5 active · 5 closed
Oceanside · Single Family Residence
Listed 4.2% above the median closed sale of $600,000. Price per sqft ($592) is a 14% discount to closed comps ($688). Closed comps sold at 102% of list — strong seller's market.
Price Position
Aligned with the market — fair pricing for the comps.
Active Properties (5)
Active Comparables
| Address | City | Year | BD | BTH | SqFt | LotSz | LP/SqFt | LP | DIM | Score |
|---|---|---|---|---|---|---|---|---|---|---|
| 4753 Calle Estrella | Oceanside | 1972 | 3 | 2 | 1,245 | 4,000 | $545 | $679,000 | 20 | 89 |
| 4609 Calle Del Palo | Oceanside | 1979 | 3 | 1 | 827 | 3,600 | $724 | $599,000 | 9 | 86 |
| 4932 Verde Drive | Oceanside | 1964 | 3 | 2 | 988 | 7,300 | $697 | $689,000 | 39 | 85 |
| 4658 Calle del Palo | Oceanside | 1980 | 2 | 1 | 827 | 3,673 | $700 | $579,000 | 30 | 83 |
| 178 Harrison Street | Oceanside | 1976 | 4 | 2 | 1,308 | 6,088 | $535 | $699,985 | 10 | 73 |
| Total: 5 · Average | 3.0 | 1.6 | 1,039 | 4,932.2 | $640.2 | $649,197 | 21.6 | |||
| Median | 988 | $679,000 | ||||||||
Closed Properties (5)
Closed Comparables
| Address | City | Year | Date | BD | BTH | SqFt | LotSz | LP | SP | SP/SqFt | SP/LP | DIM | Score |
|---|---|---|---|---|---|---|---|---|---|---|---|---|---|
| 395 Calle Mariposa | Oceanside | 1972 | 08/14/2026 | 2 | 1 | 902 | 3,400 | $595,000 | $603,000 | $669 | 1.01 | 58 | 87 |
| 4781 Calle Las Positas | Oceanside | 1972 | 05/05/2026 | 2 | 1 | 902 | 3,400 | $610,000 | $610,000 | $676 | 1.00 | 56 | 85 |
| 309 Calle Montecito | Oceanside | 1972 | 10/13/2026 | 2 | 1 | 902 | 3,973 | $579,999 | $585,000 | $649 | 1.01 | 95 | 85 |
| 4608 Calle De Retiro | Oceanside | 1979 | 06/12/2026 | 3 | 1 | 820 | 3,485 | $549,999 | $600,000 | $732 | 1.09 | 54 | 85 |
| 289 Lustrosos Street | Oceanside | 1981 | 08/25/2026 | 2 | 1 | 827 | 3,414 | $589,999 | $590,000 | $713 | 1.00 | 35 | 83 |
| Total: 5 · Average | 2.2 | 1.0 | 870.6 | 3,534.4 | $597,600 | $597,600 | $687.8 | — | 59.6 | ||||
| Median | 902 | $600,000 | $600,000 | ||||||||||
Market Analysis
List vs Sale $/SqFt
Sale Price Trend
Days on Market
Sale vs List Price
This analysis was generated automatically from MLS data. For an in-depth, human-reviewed valuation, contact Joseph Sardella at josephsardella@gmail.com.