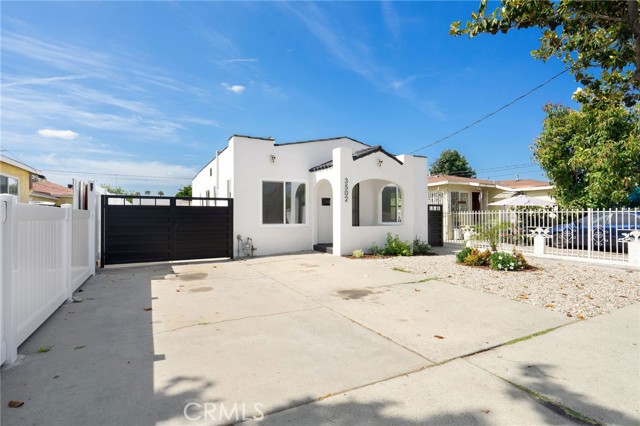
3502 West 111th, Inglewood, CA 90303
3502 West 111th, Inglewood, CA 90303
Property Description
VACANT and Move-In Ready! This 2-bedroom/1-bathroom with office has been newly remodeled with no expense spared! Updates include the kitchen, bathroom, copper plumbing, new windows, new AC splits, newly painted interior/exterior and new electrical systems. The property also comes with a newly remodeled stand-alone Non-Conforming Studio (400sqft)! Perfect for a family looking to occupy both, or it opens the possibility to AirBnB in time for the World Cup & Olympics! Close proximity to Intuit Dome, SoFi Stadium, The Kia Forum, Hollywood Park Casino, Costco, ALDI, & various restaurants. Do not miss this amazing turn-key opportunity! Caveat Emptor, to be sold as-is.
Features & Amenities
Property Details
Mortgage Calculator
Current Rates
Comparative Market Analysis
Affordable Tier · 5 active · 5 closed
Inglewood · Single Family Residence
Listed 10.0% above the median closed sale of $800,000. Price per sqft ($1,106) is a 90% premium to closed comps ($583). Closed comps sold at 103% of list — strong seller's market.
Price Position
Positioned above the market — commands a premium.
Active Properties (5)
Active Comparables
| Address | City | Year | BD | BTH | SqFt | LotSz | LP/SqFt | LP | DIM | Score |
|---|---|---|---|---|---|---|---|---|---|---|
| 3855 115th | Hawthorne | 1924 | 2 | 1 | 936 | 5,998 | $854 | $799,000 | 1 | 89 |
| 3803 107th Street | Inglewood | 1922 | 2 | 1 | 840 | 11,783 | $1,190 | $1.00M | 81 | 88 |
| 4134 107th | Inglewood | 1925 | 3 | 2 | 1,143 | 4,166 | $661 | $755,000 | 66 | 73 |
| 3612 113th | Inglewood | 1942 | 3 | 2 | 1,370 | 6,029 | $577 | $790,000 | 73 | 68 |
| 11125 Osage Avenue | Inglewood | 1922 | 3 | 2 | 1,441 | 7,293 | $554 | $799,000 | 123 | 60 |
| Total: 5 · Average | 2.6 | 1.6 | 1,146 | 7,053.8 | $767.2 | $828,600 | 68.8 | |||
| Median | 1,143 | $799,000 | ||||||||
Closed Properties (5)
Closed Comparables
| Address | City | Year | Date | BD | BTH | SqFt | LotSz | LP | SP | SP/SqFt | SP/LP | DIM | Score |
|---|---|---|---|---|---|---|---|---|---|---|---|---|---|
| 3221 113th Street | Inglewood | 1950 | 08/19/2026 | 3 | 1 | 1,089 | 6,032 | $749,000 | $749,000 | $688 | 1.00 | 20 | 77 |
| 3625 106th | Inglewood | 1954 | 09/18/2026 | 3 | 2 | 1,220 | 6,400 | $699,999 | $778,000 | $638 | 1.11 | 84 | 69 |
| 10947 Atkinson | Inglewood | 1953 | 07/22/2026 | 3 | 2 | 1,290 | 5,403 | $799,000 | $800,000 | $620 | 1.00 | 40 | 66 |
| 3542 117th Street | Inglewood | 1938 | 09/10/2026 | 2 | 2 | 1,758 | 7,380 | $790,000 | $825,000 | $469 | 1.04 | 105 | 60 |
| 10725 8th Avenue | Inglewood | 1954 | 09/22/2026 | 3 | 2 | 1,646 | 6,845 | $840,000 | $820,000 | $498 | 0.98 | 49 | 57 |
| Total: 5 · Average | 2.8 | 1.8 | 1,400.6 | 6,412 | $794,400 | $794,400 | $582.6 | — | 59.6 | ||||
| Median | 1,290 | $800,000 | $800,000 | ||||||||||
Market Analysis
List vs Sale $/SqFt
Sale Price Trend
Days on Market
Sale vs List Price
This analysis was generated automatically from MLS data. For an in-depth, human-reviewed valuation, contact Joseph Sardella at josephsardella@gmail.com.