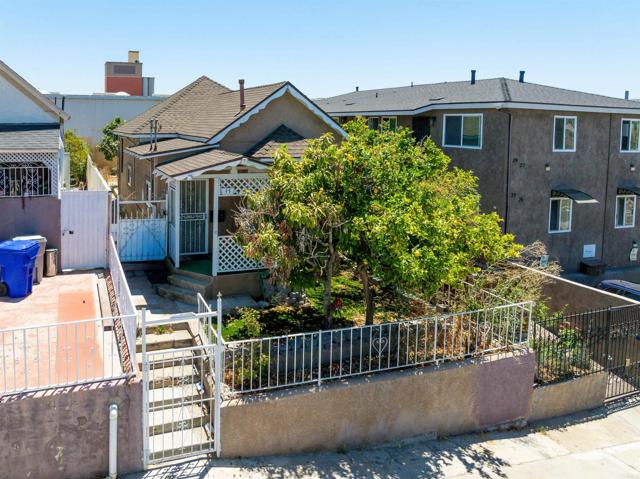
35 19Th Street, San Diego, CA 92102
35 19Th Street, San Diego, CA 92102
Property Description
Enjoy the best of urban living in this charming 2-bedroom, 1-bath home, ideally located within walking distance to downtown San Diego and Petco Park. Inside, you'll find a bright and open living room, an updated kitchen, recessed lighting, and durable vinyl flooring throughout. Step outside to a private backyard with mature fruit trees, perfect for relaxing or entertaining, while the gated front yard adds both charm and privacy. Conveniently located near shopping, dining, entertainment, and major freeways, this home offers an incredible opportunity to enjoy everything San Diego has to offer. Seller willing to entertain rental options.
Features & Amenities
Property Details
Mortgage Calculator
Current Rates
Comparative Market Analysis
Affordable Tier · 5 active · 5 closed
San Diego · Single Family Residence
Listed in line with the median closed sale of $600,000. Price per sqft ($995) is a 30% premium to closed comps ($768).
Price Position
Aligned with the market — fair pricing for the comps.
Active Properties (5)
Active Comparables
| Address | City | Year | BD | BTH | SqFt | LotSz | LP/SqFt | LP | DIM | Score |
|---|---|---|---|---|---|---|---|---|---|---|
| 338 Hoitt Street | San Diego | 1928 | 2 | 2 | 660 | 3,577 | $1,008 | $665,000 | 32 | 79 |
| 2023 Market | San Diego | 1920 | 1 | 1 | 352 | 845 | $1,491 | $524,900 | 67 | 72 |
| 3170 L Street | San Diego | 2026 | 2 | 2 | 797 | 1,392 | $847 | $675,000 | 34 | 71 |
| 264 39th Street | San Diego | 1925 | 2 | 2 | 736 | 2,943 | $849 | $625,000 | 6 | 67 |
| 3990 Broadway | San Diego | 1929 | 2 | 1 | 822 | 3,851 | $700 | $575,000 | 1 | 63 |
| Total: 5 · Average | 1.8 | 1.6 | 673.4 | 2,521.6 | $979 | $612,980 | 28 | |||
| Median | 736 | $625,000 | ||||||||
Closed Properties (5)
Closed Comparables
| Address | City | Year | Date | BD | BTH | SqFt | LotSz | LP | SP | SP/SqFt | SP/LP | DIM | Score |
|---|---|---|---|---|---|---|---|---|---|---|---|---|---|
| 35 19th Street | San Diego | 2000 | 12/17/2025 | 2 | 1 | 602 | 2,500 | $549,000 | $550,000 | $914 | 1.00 | 61 | 93 |
| 2501 L St. | San Diego | 1917 | 07/27/2026 | 2 | 1 | 632 | 1,680 | $630,000 | $630,000 | $997 | 1.00 | 82 | 85 |
| 1728 National Avenue | San Diego | 2008 | 11/19/2025 | 3 | 2 | 927 | 7,032 | $599,900 | $593,000 | $640 | 0.99 | 82 | 67 |
| 2267 Harrison Avenue | San Diego | 2003 | 10/29/2026 | 3 | 1 | 1,004 | 4,665 | $600,000 | $600,000 | $598 | 1.00 | 23 | 66 |
| 2823 Webster Avenue | San Diego | 1913 | 04/08/2026 | 2 | 2 | 880 | 3,414 | $610,000 | $610,000 | $693 | 1.00 | 121 | 66 |
| Total: 5 · Average | 2.4 | 1.4 | 809 | 3,858.2 | $596,600 | $596,600 | $768.4 | — | 73.8 | ||||
| Median | 880 | $600,000 | $600,000 | ||||||||||
Market Analysis
List vs Sale $/SqFt
Sale Price Trend
Days on Market
Sale vs List Price
This analysis was generated automatically from MLS data. For an in-depth, human-reviewed valuation, contact Joseph Sardella at josephsardella@gmail.com.