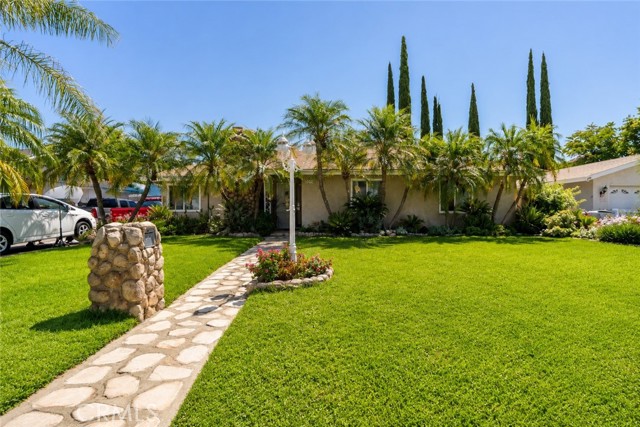
3439 Acacia, San Bernardino, CA 92405
3439 Acacia, San Bernardino, CA 92405
Property Description
Discover the perfect place to call home in North San Bernardino! This very well-kept 3-bedroom, 2-bathroom home offers a comfortable and functional layout with pride of ownership throughout. Enjoy spacious living areas, generously sized bedrooms, and two full bathrooms designed for everyday convenience. Located in an established North San Bernardino neighborhood, this home offers convenient access to shopping, dining, schools, parks, and major commuter routes. Whether you're a first-time buyer, growing household, or looking for your next investment opportunity, this property is move-in ready and ready for its next chapter. Don't miss the opportunity to own this beautifully maintained home in North San Bernardino!
Features & Amenities
Property Details
Mortgage Calculator
Current Rates
Comparative Market Analysis
Affordable Tier · 5 active · 5 closed
San Bernardino · Single Family Residence
Listed 6.5% above the median closed sale of $525,000. Closed comps sold at 102% of list — strong seller's market.
Price Position
Positioned above the market — commands a premium.
Active Properties (5)
Active Comparables
| Address | City | Year | BD | BTH | SqFt | LotSz | LP/SqFt | LP | DIM | Score |
|---|---|---|---|---|---|---|---|---|---|---|
| 3125 Mayfield | San Bernardino | 1950 | 3 | 2 | 1,650 | 6,350 | $321 | $529,900 | 16 | 86 |
| 3177 Stoddard Avenue | San Bernardino | 1928 | 3 | 2 | 1,482 | 6,850 | $371 | $550,000 | 16 | 85 |
| 734 Lee | San Bernardino | 1950 | 3 | 1 | 1,044 | 6,000 | $479 | $499,900 | 164 | 80 |
| 669 Marshall | San Bernardino | 1927 | 2 | 1 | 966 | 5,280 | $506 | $489,000 | 2 | 74 |
| 640 31st Street | San Bernardino | 1945 | 3 | 2 | 2,002 | 15,740 | $309 | $619,000 | 83 | 73 |
| Total: 5 · Average | 2.8 | 1.6 | 1,428.8 | 8,044 | $397.2 | $537,560 | 56.2 | |||
| Median | 1,482 | $529,900 | ||||||||
Closed Properties (5)
Closed Comparables
| Address | City | Year | Date | BD | BTH | SqFt | LotSz | LP | SP | SP/SqFt | SP/LP | DIM | Score |
|---|---|---|---|---|---|---|---|---|---|---|---|---|---|
| 3524 Stoddard | San Bernardino | 1951 | 09/15/2026 | 2 | 2 | 1,285 | 5,700 | $491,000 | $510,000 | $397 | 1.04 | 116 | 89 |
| 3323 N Mayfield Ave | San Bernardino | 1942 | 10/30/2026 | 3 | 2 | 1,363 | 6,577 | $554,800 | $550,000 | $404 | 0.99 | 61 | 89 |
| 3180 N Arrowhead Ave. | San Bernardino | 1941 | 07/31/2026 | 3 | 2 | 1,328 | 8,382 | $525,000 | $545,000 | $410 | 1.04 | 36 | 88 |
| 3275 F | San Bernardino | 1955 | 10/09/2026 | 3 | 1 | 1,258 | 7,020 | $489,900 | $500,000 | $397 | 1.02 | 55 | 87 |
| 3489 E Street | San Bernardino | 1949 | 12/11/2025 | 3 | 2 | 1,499 | 8,382 | $525,000 | $525,000 | $350 | 1.00 | 36 | 87 |
| Total: 5 · Average | 2.8 | 1.8 | 1,346.6 | 7,212.2 | $526,000 | $526,000 | $391.6 | — | 60.8 | ||||
| Median | 1,328 | $525,000 | $525,000 | ||||||||||
Market Analysis
List vs Sale $/SqFt
Sale Price Trend
Days on Market
Sale vs List Price
This analysis was generated automatically from MLS data. For an in-depth, human-reviewed valuation, contact Joseph Sardella at josephsardella@gmail.com.