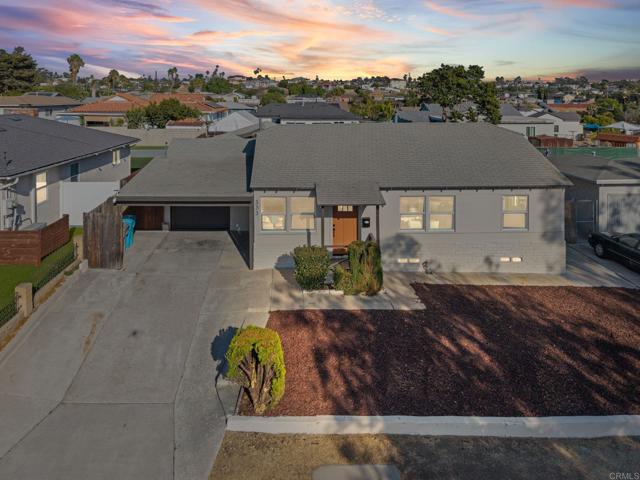
333 South Euclid Avenue, San Diego, CA 92114
333 South Euclid Avenue, San Diego, CA 92114
Property Description
Beautifully renovated home located in the Encanto community of San Diego. The main residence features 3 bedrooms and 1 bathroom with a fresh, modern interior, an updated kitchen, remodeled bathroom, and a bright, functional layout designed for comfortable everyday living. The property also includes a detached additional living space with its own bathroom and kitchenette, offering added flexibility for extended family, guests, a home office, creative space, or potential additional income. Move-in ready and conveniently located near shopping, dining, schools, parks, and major freeways, this property offers the perfect combination of updated living, versatility, and extra space. A unique opportunity with multiple possibilities in a convenient San Diego location.
Features & Amenities
Property Details
Mortgage Calculator
Current Rates
Comparative Market Analysis
Residential Tier · 5 active · 5 closed
San Diego · Single Family Residence
Listed 3.4% above the median closed sale of $773,600. Price per sqft ($474) is a 19% discount to closed comps ($584).
Price Position
Aligned with the market — fair pricing for the comps.
Active Properties (5)
Active Comparables
| Address | City | Year | BD | BTH | SqFt | LotSz | LP/SqFt | LP | DIM | Score |
|---|---|---|---|---|---|---|---|---|---|---|
| 5472 San Onofre | San Diego | 1957 | 4 | 2 | 1,800 | 7,600 | $500 | $900,000 | 122 | 89 |
| 4966 Ocean View Boulevard | San Diego | 2026 | 3 | 3 | 1,479 | 900 | $494 | $729,900 | 49 | 76 |
| 4984 Ocean View Boulevard | San Diego | 2026 | 3 | 3 | 1,420 | 999 | $511 | $725,900 | 92 | 75 |
| 4954 Ocean View Boulevard | San Diego | 2026 | 3 | 3 | 1,479 | 900 | $471 | $695,900 | 162 | 74 |
| 4976 Ocean View Boulevard | San Diego | 2026 | 3 | 3 | 1,420 | 999 | $490 | $695,900 | 138 | 74 |
| Total: 5 · Average | 3.2 | 2.8 | 1,519.6 | 2,279.6 | $493.2 | $749,520 | 112.6 | |||
| Median | 1,479 | $725,900 | ||||||||
Closed Properties (5)
Closed Comparables
| Address | City | Year | Date | BD | BTH | SqFt | LotSz | LP | SP | SP/SqFt | SP/LP | DIM | Score |
|---|---|---|---|---|---|---|---|---|---|---|---|---|---|
| 5260 La Paz Drive | San Diego | 1950 | 06/15/2026 | 4 | 2 | 1,623 | 8,000 | $799,999 | $773,600 | $477 | 0.97 | 66 | 91 |
| 5304 Olvera Avenue | San Diego | 1951 | 02/17/2026 | 4 | 2 | 1,388 | 0 | $762,000 | $762,000 | $549 | 1.00 | 33 | 87 |
| 5474 Olvera Ave | San Diego | 1951 | 02/05/2026 | 3 | 2 | 1,873 | 6,900 | $889,000 | $889,000 | $475 | 1.00 | 36 | 85 |
| 5535 Churchward St | San Diego | 1947 | 07/17/2026 | 3 | 2 | 1,133 | 6,700 | $799,000 | $790,000 | $697 | 0.99 | 128 | 82 |
| 5033 LA PAZ DR | San Diego | 1956 | 02/03/2026 | 3 | 2 | 1,050 | 6,500 | $749,999 | $757,000 | $721 | 1.01 | 56 | 80 |
| Total: 5 · Average | 3.4 | 2.0 | 1,413.4 | 7,025 | $794,320 | $794,320 | $583.8 | — | 63.8 | ||||
| Median | 1,388 | $773,600 | $773,600 | ||||||||||
Market Analysis
List vs Sale $/SqFt
Sale Price Trend
Days on Market
Sale vs List Price
This analysis was generated automatically from MLS data. For an in-depth, human-reviewed valuation, contact Joseph Sardella at josephsardella@gmail.com.