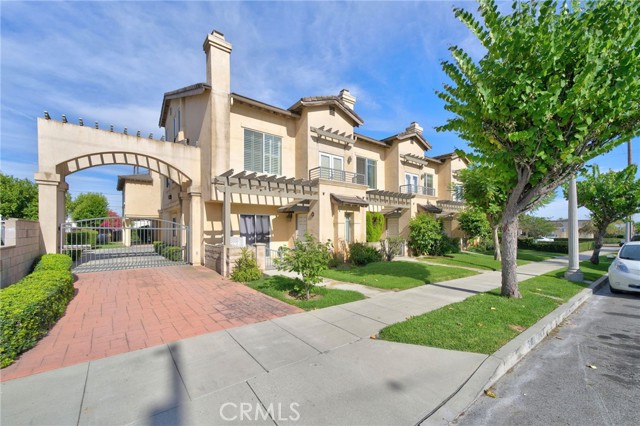
330 South Pine Street, San Gabriel, CA 91776
330 South Pine Street, San Gabriel, CA 91776
Property Description
Welcome to this special home in the City of San Gabriel! The Vaulted living room features south-facing windows that fill the space with natural light and a refreshing breeze. Three bedrooms and three bathrooms thoughtfully situated across each floor (one bedroom and bath on the first floor). This home offers a unique, highly functional layout designed for comfort and privacy. Perfectly located, this property is within walking distance to markets, restaurants, and all the essential amenities you need right at your doorstep. Additional highlights include a two-car garage and ample street parking. This home is well priced and must-see!
Features & Amenities
Property Details
Mortgage Calculator
Current Rates
Comparative Market Analysis
Residential Tier · 5 active · 5 closed
San Gabriel · Townhouse
Listed in line with the median closed sale of $900,000. Price per sqft ($472) is a 11% discount to closed comps ($528). Closed comps sold at 100% of list — strong seller's market.
Price Position
Aligned with the market — fair pricing for the comps.
Active Properties (5)
Active Comparables
| Address | City | Year | BD | BTH | SqFt | LotSz | LP/SqFt | LP | DIM | Score |
|---|---|---|---|---|---|---|---|---|---|---|
| 5540 Sutana Avenue | Temple City | 1992 | 3 | 4 | 1,453 | 0 | $604 | $878,000 | 12 | 78 |
| 137 Saint Francis Street | San Gabriel | 2024 | 2 | 3 | 1,556 | 24,394 | $585 | $910,000 | 313 | 75 |
| 417 Baltimore Avenue | Monterey Park | 1987 | 4 | 4 | 1,743 | 18,947 | $441 | $768,000 | 12 | 62 |
| 1006 Arcadia | Arcadia | 1980 | 2 | 3 | 1,514 | 19,006 | $527 | $798,000 | 240 | 61 |
| 210 New Avenue | Monterey Park | 2025 | 3 | 3 | 1,377 | 121,860 | $654 | $899,998 | 51 | 58 |
| Total: 5 · Average | 2.8 | 3.4 | 1,528.6 | 46,051.75 | $562.2 | $850,799.6 | 125.6 | |||
| Median | 1,514 | $878,000 | ||||||||
Closed Properties (5)
Closed Comparables
| Address | City | Year | Date | BD | BTH | SqFt | LotSz | LP | SP | SP/SqFt | SP/LP | DIM | Score |
|---|---|---|---|---|---|---|---|---|---|---|---|---|---|
| 6227 Sultana Avenue | Temple City | 1985 | 11/07/2025 | 3 | 3 | 1,820 | 14,540 | $928,000 | $900,000 | $495 | 0.97 | 87 | 77 |
| 301 Bencamp #A Street | San Gabriel | 2008 | 06/08/2026 | 3 | 2 | 1,560 | 12,858 | $830,000 | $828,000 | $531 | 1.00 | 71 | 76 |
| 5067 Sereno Dr | Temple City | 2009 | 08/14/2026 | 4 | 3 | 1,585 | 27,589 | $939,000 | $988,000 | $623 | 1.05 | 22 | 73 |
| 309 Almansor Street | Alhambra | 2001 | 05/27/2026 | 4 | 2 | 1,894 | 23,984 | $958,000 | $955,000 | $504 | 1.00 | 43 | 72 |
| 525 Almansor Street | Alhambra | 1981 | 09/22/2026 | 3 | 3 | 1,610 | 1,891 | $786,000 | $785,000 | $488 | 1.00 | 63 | 70 |
| Total: 5 · Average | 3.4 | 2.6 | 1,693.8 | 16,172.4 | $891,200 | $891,200 | $528.2 | — | 57.2 | ||||
| Median | 1,610 | $900,000 | $900,000 | ||||||||||
Market Analysis
List vs Sale $/SqFt
Sale Price Trend
Days on Market
Sale vs List Price
This analysis was generated automatically from MLS data. For an in-depth, human-reviewed valuation, contact Joseph Sardella at josephsardella@gmail.com.