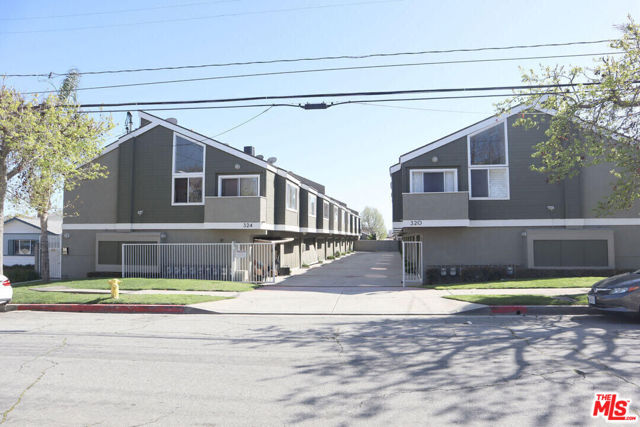
324 East Plymouth Street, 16, Inglewood, CA 90302
324 East Plymouth Street, 16, Inglewood, CA 90302
Property Description
Lovely two-story condo with a townhouse feel. Upon entry, you're greeted by a light and bright interior with soaring vaulted ceilings, an expansive window seat and plantation style shutters in the living space. This unit has two bedrooms and two bathrooms. The kitchen is equipped with nice neutral stone countertops, white cabinetry, sleek appliances, and a breakfast bar. Two-car garage with direct access! The complex is securely fenced and gated. Enjoy easy access to nearby grocery stores, parks, and the SoFi Stadium. Currently tenant-occupied.
Features & Amenities
Property Details
Mortgage Calculator
Current Rates
Comparative Market Analysis
Affordable Tier · 5 active · 5 closed
Inglewood · Condominium
Listed 13.2% above the median closed sale of $530,000. Price per sqft ($706) is a 42% premium to closed comps ($498).
Price Position
Positioned above the market — commands a premium.
Active Properties (5)
Active Comparables
| Address | City | Year | BD | BTH | SqFt | LotSz | LP/SqFt | LP | DIM | Score |
|---|---|---|---|---|---|---|---|---|---|---|
| 812 Inglewood | Inglewood | 1986 | 2 | 3 | 824 | 0 | $629 | $518,000 | 222 | 85 |
| 313 Hyde Park | Inglewood | 1987 | 3 | 2 | 1,086 | 27,748 | $516 | $560,000 | 141 | 84 |
| 6922 Knowlton Place | Los Angeles | 1997 | 2 | 2 | 1,160 | 20,707 | $517 | $599,900 | 24 | 76 |
| 810 Edgewood Street | Inglewood | 1964 | 3 | 2 | 1,193 | 13,106 | $503 | $600,000 | 8 | 75 |
| 321 W. Queen St. Unit 8 | Inglewood | 1992 | 3 | 3 | 1,317 | 19,260 | $417 | $549,000 | 3 | 67 |
| Total: 5 · Average | 2.6 | 2.4 | 1,116 | 20,205.25 | $516.4 | $565,380 | 79.6 | |||
| Median | 1,160 | $560,000 | ||||||||
Closed Properties (5)
Closed Comparables
| Address | City | Year | Date | BD | BTH | SqFt | LotSz | LP | SP | SP/SqFt | SP/LP | DIM | Score |
|---|---|---|---|---|---|---|---|---|---|---|---|---|---|
| 907 Inglewood Avenue | Inglewood | 1987 | 06/29/2026 | 2 | 2 | 1,090 | 7,504 | $520,000 | $515,000 | $472 | 0.99 | 80 | 81 |
| 419 Exton Avenue | Inglewood | 1988 | 06/17/2026 | 2 | 2 | 1,132 | 9,058 | $515,000 | $520,000 | $459 | 1.01 | 30 | 81 |
| 856 Beach Avenue | Inglewood | 1989 | 08/19/2026 | 2 | 3 | 1,051 | 25,104 | $549,000 | $555,555 | $529 | 1.01 | 42 | 81 |
| 822 Victor Avenue | Inglewood | 1981 | 10/07/2026 | 2 | 3 | 1,086 | 22,424 | $559,000 | $562,000 | $517 | 1.00 | 65 | 79 |
| 800 Glenway Drive | Inglewood | 1990 | 06/30/2026 | 2 | 3 | 1,034 | 0 | $545,000 | $530,000 | $513 | 0.97 | 81 | 79 |
| Total: 5 · Average | 2.0 | 2.6 | 1,078.6 | 16,022.5 | $536,511 | $536,511 | $498 | — | 59.6 | ||||
| Median | 1,086 | $530,000 | $530,000 | ||||||||||
Market Analysis
List vs Sale $/SqFt
Sale Price Trend
Days on Market
Sale vs List Price
This analysis was generated automatically from MLS data. For an in-depth, human-reviewed valuation, contact Joseph Sardella at josephsardella@gmail.com.