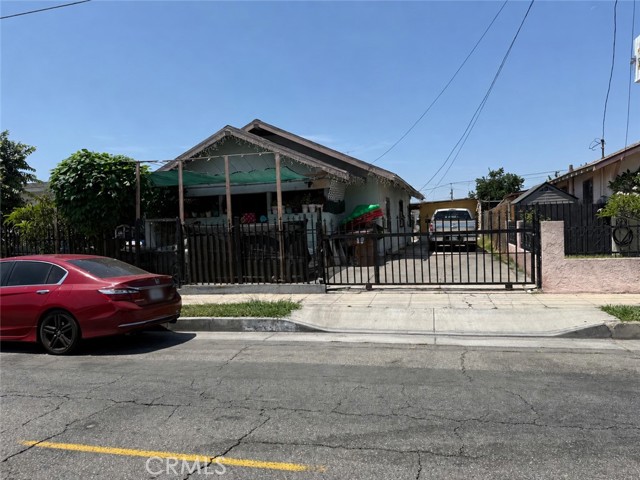
321 North Willowbrook, Compton, CA 90220
321 North Willowbrook, Compton, CA 90220
Property Description
**Excellent Investment Opportunity in Compton!** This income producing duplex presents a great opportunity for investors or owner occupants looking for a property with multiple living spaces and long term rental potential. The property features a front residence with 3 bedrooms and 2 bathrooms, along with a separate rear unit offering 2 bedrooms and 1 bathroom. Each unit has its own washer and dryer for added convenience. Additional bonus living space provides flexibility for a variety of potential uses. Buyer to verify permits and permitted use. The property is currently tenant occupied with a history of established tenancy, offering an opportunity to acquire an income producing asset in a strong rental market. Conveniently located near major freeways, shopping, dining, schools and everyday amenities, this property offers accessibility and long term investment potential.
Features & Amenities
Property Details
Mortgage Calculator
Current Rates
Comparative Market Analysis
Residential Tier · 1 active · 5 closed
Compton · Duplex
Listed in line with the median closed sale of $815,000. Price per sqft ($439) is a 19% discount to closed comps ($541). Closed comps sold at 104% of list — strong seller's market.
Price Position
Aligned with the market — fair pricing for the comps.
Active Properties (1)
Active Comparables
| Address | City | Year | BD | BTH | SqFt | LotSz | LP/SqFt | LP | DIM | Score |
|---|---|---|---|---|---|---|---|---|---|---|
| 6526 San Miguel | Paramount | 1952 | 4 | 2 | 1,675 | 6,069 | $493 | $825,000 | 25 | 68 |
| Total: 1 · Average | 4.0 | 2.0 | 1,675 | 6,069 | $493 | $825,000 | 25 | |||
| Median | 1,675 | $825,000 | ||||||||
Closed Properties (5)
Closed Comparables
| Address | City | Year | Date | BD | BTH | SqFt | LotSz | LP | SP | SP/SqFt | SP/LP | DIM | Score |
|---|---|---|---|---|---|---|---|---|---|---|---|---|---|
| 348 Peach Street | Compton | 1964 | 05/08/2026 | 4 | 2 | 1,632 | 2,071 | $749,000 | $749,000 | $459 | 1.00 | 342 | 69 |
| 1008 134th Place | Compton | 1954 | 05/14/2026 | 3 | 2 | 1,347 | 7,775 | $749,900 | $815,000 | $605 | 1.09 | 28 | 67 |
| 1571 118th | Los Angeles | 1937 | 12/19/2025 | 6 | 3 | 1,954 | 6,859 | $915,000 | $910,000 | $466 | 0.99 | 74 | 65 |
| 140 East 69th Way | Long Beach | 1950 | 04/23/2026 | 3 | 2 | 1,567 | 8,657 | $799,000 | $845,000 | $539 | 1.06 | 56 | 64 |
| 11641 State | Lynwood | 1953 | 10/27/2026 | 2 | 1 | 1,174 | 6,112 | $700,000 | $745,000 | $635 | 1.06 | 53 | 62 |
| Total: 5 · Average | 3.6 | 2.0 | 1,534.8 | 6,294.8 | $812,800 | $812,800 | $540.8 | — | 110.6 | ||||
| Median | 1,567 | $815,000 | $815,000 | ||||||||||
Market Analysis
List vs Sale $/SqFt
Sale Price Trend
Days on Market
Sale vs List Price
This analysis was generated automatically from MLS data. For an in-depth, human-reviewed valuation, contact Joseph Sardella at josephsardella@gmail.com.