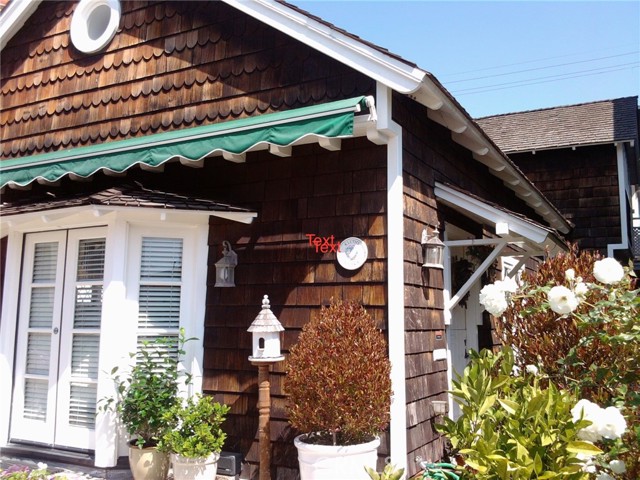
314 Ruby Avenue, Newport Beach, CA 92662
314 Ruby Avenue, Newport Beach, CA 92662
Property Description
Starting June 1st 2026 - Rent this beautiful completely renovated to perfection cape cod home comes completely furnished. Rents monthly is available for . $8,000.00 a month off-season and $16,000.00 a month in the Summer 2026 June, July, August. Call for availability. This property has not been measured, so not guaranteed owner and Realtor not responsible for accuracy of the measurements.
Features & Amenities
Property Details
Mortgage Calculator
Current Rates
Comparative Market Analysis
Affordable Tier · 5 active · 5 closed
Newport Beach · Duplex
Listed within 5% of the median closed sale price of $8,000. At $5/sqft, the subject is below the comp average of $618/sqft. Comparable homes are selling above list price (13223.9%) — strong seller's market in this segment. Average days on market is 165 — expect a longer selling timeline in this segment.
Price Position
Aligned with the market — fair pricing for the comps.
Active Properties (5)
Active Comparables
| Address | City | Year | BD | BTH | SqFt | LotSz | LP/SqFt | LP | DIM | Score |
|---|---|---|---|---|---|---|---|---|---|---|
| 119 46th St "Upper", B, Newport Beach, CA 92663 | Newport Beach | 1965 | 3 | 2 | 1,300 | 2,549 | $6 | $7,500 | 236 | 68 |
| 320 Catalina Drive, A, Newport Beach, CA 92663 | Newport Beach | 1973 | 3 | 2 | 1,200 | 5,854 | $4 | $5,250 | 41 | 68 |
| 216 Collins, Newport Beach, CA 92662 | Newport Beach | 1956 | 3 | 2 | 1,200 | 2,614 | $7 | $8,000 | 216 | 63 |
| 1009 North Bay Front, Newport Beach, CA 92662 | Newport Beach | 1945 | 3 | 2 | 1,200 | 1,500 | $10 | $12,000 | 251 | 61 |
| 400 40th Street, Newport Beach, CA 92663 | Newport Beach | 2022 | 3 | 4 | 1,650 | 2,850 | $8 | $12,500 | 27 | 60 |
| Total: 5 · Average | 3.0 | 2.4 | 1,310 | 3,073 | $7 | $9,050 | 154 | |||
| Median | 1,200 | $8,000 | ||||||||
Closed Properties (5)
Closed Comparables
| Address | City | Year | Date | BD | BTH | SqFt | LotSz | LP | SP | SP/SqFt | SP/LP | DIM | Score |
|---|---|---|---|---|---|---|---|---|---|---|---|---|---|
| 711 North Bayfront, Newport Beach, CA 92662 | Newport Beach | 1970 | 01/09/2025 | 3 | 2 | 1,500 | 2,550 | $7,000 | $7,500 | $5 | 1.07 | 519 | 73 |
| 210 Grant Street, B, Newport Beach, CA 92663 | Newport Beach | 1972 | 12/17/2024 | 3 | 2 | 1,300 | 2,492 | $5,950 | $5,850 | $5 | 0.98 | 191 | 69 |
| 6303 Seashore, Newport Beach, CA 92663 | Newport Beach | 1968 | 07/27/2024 | 3 | 2 | 1,500 | 3,049 | $7,000 | $4.60M | $3,067 | 657.14 | 25 | 69 |
| 6306 West Oceanfront, B, Newport Beach, CA 92663 | Newport Beach | 1970 | 10/08/2024 | 4 | 2 | 1,600 | 2,178 | $8,000 | $8,000 | $5 | 1.00 | 84 | 68 |
| 6308 West Oceanfront, A, Newport Beach, CA 92663 | Newport Beach | 1972 | 08/07/2024 | 3 | 2 | 1,656 | 2,178 | $10,750 | $10,750 | $6 | 1.00 | 7 | 67 |
| Total: 5 · Average | 3.2 | 2.0 | 1,511 | 2,489 | $926,420 | $926,420 | $0 | 132.24 | 165 | ||||
| Median | 1,500 | $8,000 | $8,000 | ||||||||||
Market Analysis
List vs Sale $/SqFt
Sale Price Trend
Days on Market
Sale vs List Price
This analysis was generated automatically from MLS data. For an in-depth, human-reviewed valuation, contact Joseph Sardella at josephsardella@gmail.com.