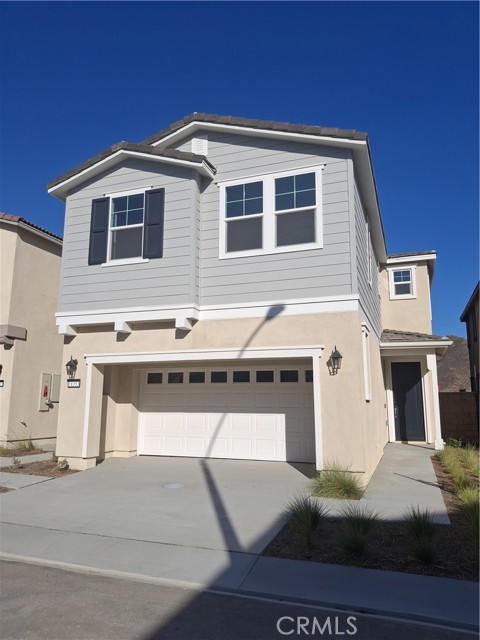
31353 Osage Trail, Winchester, CA 92596
31353 Osage Trail, Winchester, CA 92596
Property Description
A charming covered entry welcomes guests to the handsome Logan plan. Pass a study and powder room on your way to open dining and great rooms, which flow into a thoughtfully designed kitchen offering a pantry and a center island. Highlights of the second floor include a large loft, a convenient laundry, two secondary bedrooms with a shared bath, and a luxurious primary suite boasting an oversized walk-in closet and private bath with double sinks. Designer-curated fixtures and finishes are included. Visit today!
Features & Amenities
Property Details
Mortgage Calculator
Current Rates
Comparative Market Analysis
Residential Tier · 5 active · 5 closed
Winchester · Condominium
Listed 3.3% below the median closed sale of $605,000. Price per sqft ($244) is a 18% discount to closed comps ($298).
Price Position
Aligned with the market — fair pricing for the comps.
Active Properties (5)
Active Comparables
| Address | City | Year | BD | BTH | SqFt | LotSz | LP/SqFt | LP | DIM | Score |
|---|---|---|---|---|---|---|---|---|---|---|
| 31353 Osage Trail | Winchester | 2026 | 4 | 3 | 2,402 | 2,801 | $264 | $634,347 | 123 | 95 |
| 44848 Guadalupe Drive | Indian Wells | 1979 | 3 | 3 | 2,517 | 5,998 | $219 | $550,000 | 17 | 74 |
| 76796 Kybar Road | Palm Desert | 1999 | 3 | 2 | 1,787 | 2,178 | $330 | $589,000 | 26 | 65 |
| 44602 Monaco Circle | Palm Desert | 1980 | 3 | 2 | 1,584 | 4,356 | $315 | $498,500 | 9 | 64 |
| 42922 Scirocco Road | Palm Desert | 1987 | 2 | 2 | 1,295 | 4,078 | $386 | $499,999 | 43 | 61 |
| Total: 5 · Average | 3.0 | 2.4 | 1,917 | 3,882.2 | $302.8 | $554,369.2 | 43.6 | |||
| Median | 1,787 | $550,000 | ||||||||
Closed Properties (5)
Closed Comparables
| Address | City | Year | Date | BD | BTH | SqFt | LotSz | LP | SP | SP/SqFt | SP/LP | DIM | Score |
|---|---|---|---|---|---|---|---|---|---|---|---|---|---|
| 45885 Algonquin Circle | Indian Wells | 1979 | 07/10/2026 | 3 | 3 | 2,489 | 3,920 | $665,000 | $665,000 | $267 | 1.00 | 11 | 79 |
| 45915 Algonquin Circle | Indian Wells | 1979 | 09/04/2026 | 3 | 3 | 2,399 | 4,356 | $650,000 | $650,000 | $271 | 1.00 | 27 | 78 |
| 74984 Chateau Circle | Indian Wells | 1975 | 08/13/2026 | 3 | 3 | 1,947 | 2,849 | $519,000 | $510,000 | $262 | 0.98 | 43 | 78 |
| 74903 Chateau Circle | Indian Wells | 1975 | 12/31/2025 | 3 | 3 | 1,947 | 3,049 | $619,000 | $575,000 | $295 | 0.93 | 263 | 72 |
| 75550 Calle Del Sur | Indian Wells | 1964 | 02/13/2026 | 2 | 2 | 1,530 | 3,049 | $625,500 | $605,000 | $395 | 0.97 | 72 | 70 |
| Total: 5 · Average | 2.8 | 2.8 | 2,062.4 | 3,444.6 | $601,000 | $601,000 | $298 | — | 83.2 | ||||
| Median | 1,947 | $605,000 | $605,000 | ||||||||||
Market Analysis
List vs Sale $/SqFt
Sale Price Trend
Days on Market
Sale vs List Price
This analysis was generated automatically from MLS data. For an in-depth, human-reviewed valuation, contact Joseph Sardella at josephsardella@gmail.com.