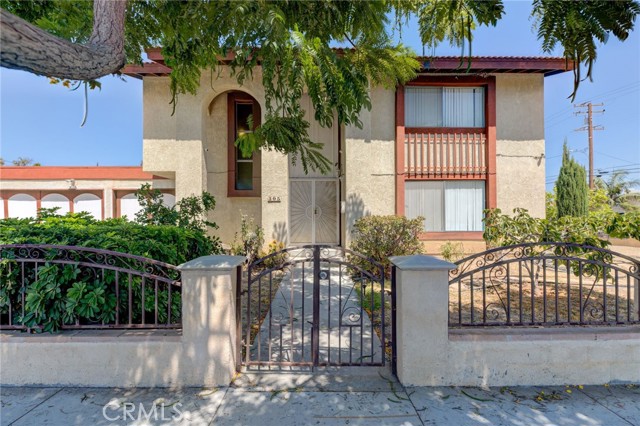
305 West 220th Street, Carson, CA 90745
305 West 220th Street, Carson, CA 90745
Property Description
HUGE PRICE REDUCTION!!! Great location of Carson!!! Large and spacious two story home. Formal living room. Separate family room with fireplace. Dining area off the kitchen. Master bedroom with master bathroom. All bedrooms are upstairs. Hallway bathroom. Convenient downstairs half bathroom. Direct access to a 3 car garage. Laundry hookups in the garage. Needs updating and cosmetic repair. This home has a lot of potential. Close to schools, shops, restaurants, and freeway access.
Features & Amenities
Property Details
Mortgage Calculator
Current Rates
Comparative Market Analysis
Residential Tier · 5 active · 5 closed
Carson · Single Family Residence
Listed 4.9% below the median closed sale of $840,000. Price per sqft ($403) is a 27% discount to closed comps ($554). Closed comps sold at 100% of list — strong seller's market.
Price Position
Aligned with the market — fair pricing for the comps.
Active Properties (5)
Active Comparables
| Address | City | Year | BD | BTH | SqFt | LotSz | LP/SqFt | LP | DIM | Score |
|---|---|---|---|---|---|---|---|---|---|---|
| 237 219th | Carson | 1957 | 3 | 3 | 1,657 | 5,545 | $453 | $750,000 | 30 | 83 |
| 361 224th | Carson | 1951 | 4 | 3 | 1,588 | 5,066 | $554 | $879,000 | 107 | 77 |
| 22330 Meyler Street | Torrance | 1990 | 4 | 3 | 2,302 | 248,831 | $399 | $918,000 | 46 | 77 |
| 22443 Meyler Street | Torrance | 1927 | 3 | 2 | 1,487 | 5,063 | $518 | $771,000 | 83 | 72 |
| 22620 Menlo | Torrance | 1954 | 3 | 2 | 1,267 | 3,844 | $599 | $759,000 | 40 | 71 |
| Total: 5 · Average | 3.4 | 2.6 | 1,660.2 | 53,669.8 | $504.6 | $815,400 | 61.2 | |||
| Median | 1,588 | $771,000 | ||||||||
Closed Properties (5)
Closed Comparables
| Address | City | Year | Date | BD | BTH | SqFt | LotSz | LP | SP | SP/SqFt | SP/LP | DIM | Score |
|---|---|---|---|---|---|---|---|---|---|---|---|---|---|
| 21313 Caroldale | Carson | 1947 | 09/14/2026 | 4 | 2 | 1,640 | 5,359 | $840,000 | $840,000 | $512 | 1.00 | 27 | 79 |
| 21827 Nicolle | Carson | 1957 | 09/04/2026 | 3 | 2 | 1,390 | 5,347 | $680,000 | $710,000 | $511 | 1.04 | 53 | 78 |
| 22024 Gulf Avenue | Carson | 1955 | 10/28/2026 | 4 | 3 | 1,216 | 5,286 | $899,000 | $890,000 | $732 | 0.99 | 21 | 78 |
| 513 Shadwell Street | Carson | 1959 | 11/13/2025 | 3 | 2 | 1,763 | 5,258 | $859,000 | $840,000 | $476 | 0.98 | 56 | 75 |
| 555 Shadwell | Carson | 1959 | 08/03/2026 | 3 | 2 | 1,613 | 6,220 | $869,900 | $869,900 | $539 | 1.00 | 34 | 75 |
| Total: 5 · Average | 3.4 | 2.2 | 1,524.4 | 5,494 | $829,980 | $829,980 | $554 | — | 38.2 | ||||
| Median | 1,613 | $840,000 | $840,000 | ||||||||||
Market Analysis
List vs Sale $/SqFt
Sale Price Trend
Days on Market
Sale vs List Price
This analysis was generated automatically from MLS data. For an in-depth, human-reviewed valuation, contact Joseph Sardella at josephsardella@gmail.com.