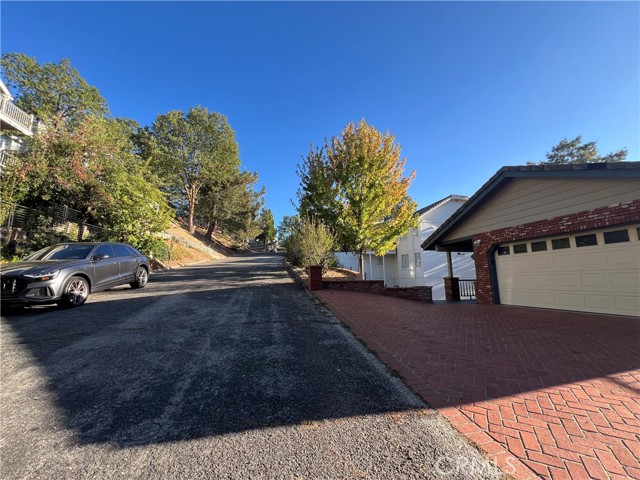
30055 Enchanted Way, Running Springs, CA 92382
30055 Enchanted Way, Running Springs, CA 92382
Property Description
Welcome to your stunning mountain getaway home in Running Springs. As you walk into this home, you are immediately drawn to the beautiful vaulted ceilings and large windows which bring in a lot of natural light. This home offers 3 large bedrooms, 3 bathrooms, a huge open kitchen with a large island, breakfast bar, plenty of storage, a walk in pantry, and a large dining room. The home offers a large and comfortable living room with a brick fireplace, perfect for cozy family game nights and entertainment. Enjoy your morning coffee while admiring the breathtaking views from any of the 3 decks. The basement is perfect for kids to hang out, extra sleeping arrangements, or for a home gym. Whether you are looking for a full time residence, weekend retreat, or vacation property, this home offers the opportunity to enjoy mountain living in the desirable community of Enchanted Estates in Running Springs. Do not miss out on the wonderful opportunity.
Features & Amenities
Property Details
Mortgage Calculator
Current Rates
Comparative Market Analysis
Residential Tier · 5 active · 5 closed
Running Springs · Single Family Residence
Listed 6.1% below the median closed sale of $575,000. Price per sqft ($194) is a 21% discount to closed comps ($247).
Price Position
Priced below the market — value advantage over the field.
Active Properties (5)
Active Comparables
| Address | City | Year | BD | BTH | SqFt | LotSz | LP/SqFt | LP | DIM | Score |
|---|---|---|---|---|---|---|---|---|---|---|
| 30139 Enchanted Way | Running Springs | 1992 | 4 | 3 | 2,713 | 10,790 | $221 | $600,000 | 40 | 83 |
| 30573 Live Oak | Running Springs | 1980 | 3 | 3 | 1,684 | 9,271 | $288 | $485,000 | 24 | 79 |
| 30042 Enchanted | Running Springs | 1981 | 6 | 3 | 3,419 | 9,530 | $165 | $565,000 | 142 | 74 |
| 30772 Knoll View | Running Springs | 1983 | 3 | 2 | 1,680 | 7,760 | $283 | $475,000 | 46 | 71 |
| 30539 Holly Drive | Running Springs | 2006 | 2 | 2 | 2,202 | 9,000 | $225 | $495,000 | 13 | 70 |
| Total: 5 · Average | 3.6 | 2.6 | 2,339.6 | 9,270.2 | $236.4 | $524,000 | 53 | |||
| Median | 2,202 | $495,000 | ||||||||
Closed Properties (5)
Closed Comparables
| Address | City | Year | Date | BD | BTH | SqFt | LotSz | LP | SP | SP/SqFt | SP/LP | DIM | Score |
|---|---|---|---|---|---|---|---|---|---|---|---|---|---|
| 30184 Skyline Drive | Running Springs | 1986 | 04/17/2026 | 3 | 3 | 2,645 | 10,000 | $599,000 | $599,000 | $226 | 1.00 | 83 | 83 |
| 1980 Willow | Running Springs | 2001 | 07/27/2026 | 3 | 3 | 2,592 | 7,590 | $599,000 | $599,000 | $231 | 1.00 | 33 | 74 |
| 2477 Spring Oak Drive | Running Springs | 1997 | 08/13/2026 | 3 | 3 | 1,700 | 7,800 | $499,000 | $490,000 | $288 | 0.98 | 202 | 71 |
| 31353 Lightfoot Way | Running Springs | 1963 | 05/28/2026 | 5 | 3 | 2,372 | 8,300 | $599,000 | $575,000 | $242 | 0.96 | 43 | 68 |
| 31349 Deer Lick | Running Springs | 1958 | 05/22/2026 | 3 | 2 | 1,886 | 7,280 | $449,000 | $467,500 | $248 | 1.04 | 118 | 67 |
| Total: 5 · Average | 3.4 | 2.8 | 2,239 | 8,194 | $546,100 | $546,100 | $247 | — | 95.8 | ||||
| Median | 2,372 | $575,000 | $575,000 | ||||||||||
Market Analysis
List vs Sale $/SqFt
Sale Price Trend
Days on Market
Sale vs List Price
This analysis was generated automatically from MLS data. For an in-depth, human-reviewed valuation, contact Joseph Sardella at josephsardella@gmail.com.