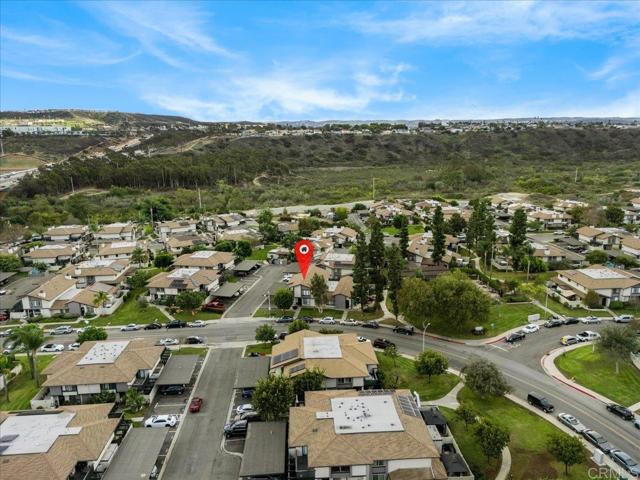
300 Rancho Drive, B, Chula Vista, CA 91911
300 Rancho Drive, B, Chula Vista, CA 91911
Property Description
Beautiful end unit with 3 bedrooms, 1.5 baths, no carpet, upgraded floors throughout, and two parking spaces close together, one covered. The upgraded kitchen includes quartz countertops and laminate flooring, and the space is freshly painted and move-in ready. You can relax on the spacious private patio, which includes a convenient laundry room. The community provides a pool close to the unit and a park, while shopping, dining, and freeway access are just minutes away—ideal for easy everyday living. The unit features a new deck patio, new window blinds, a refrigerator, and a standing stove range/oven.
Features & Amenities
Property Details
Mortgage Calculator
Current Rates
Comparative Market Analysis
Affordable Tier · 5 active · 5 closed
Chula Vista · Townhouse
Listed 3.4% below the median closed sale of $590,000. Price per sqft ($447) is a 17% premium to closed comps ($381).
Price Position
Aligned with the market — fair pricing for the comps.
Active Properties (5)
Active Comparables
| Address | City | Year | BD | BTH | SqFt | LotSz | LP/SqFt | LP | DIM | Score |
|---|---|---|---|---|---|---|---|---|---|---|
| 265 Rancho Dr | Chula Vista | 1977 | 3 | 2 | 1,228 | 0 | $432 | $530,000 | 123 | 90 |
| 766 Makani Street | Chula Vista | 2024 | 3 | 3 | 1,320 | 0 | $496 | $655,000 | 131 | 70 |
| 5230 Calle Rockfish | San Diego | 2018 | 3 | 3 | 1,452 | 0 | $430 | $625,000 | 4 | 68 |
| 804 Makani Street | Chula Vista | 2024 | 2 | 3 | 1,143 | 0 | $559 | $639,000 | 36 | 66 |
| 824 Makani Street | Chula Vista | 2024 | 2 | 3 | 1,143 | 1 | $542 | $619,900 | 48 | 66 |
| Total: 5 · Average | 2.6 | 2.8 | 1,257.2 | 1 | $491.8 | $613,780 | 68.4 | |||
| Median | 1,228 | $625,000 | ||||||||
Closed Properties (5)
Closed Comparables
| Address | City | Year | Date | BD | BTH | SqFt | LotSz | LP | SP | SP/SqFt | SP/LP | DIM | Score |
|---|---|---|---|---|---|---|---|---|---|---|---|---|---|
| 1640 Maple Dr | Chula Vista | 1974 | 09/04/2026 | 4 | 3 | 1,576 | 504,973 | $579,000 | $585,000 | $371 | 1.01 | 57 | 80 |
| 1539 Sonora Dr | Chula Vista | 1975 | 07/17/2026 | 3 | 3 | 1,440 | 43,560 | $610,000 | $610,000 | $424 | 1.00 | 50 | 78 |
| 1640 Maple Drive | Chula Vista | 1974 | 06/10/2026 | 3 | 3 | 1,782 | 504,860 | $635,000 | $638,000 | $358 | 1.00 | 36 | 78 |
| 1640 Maple Drive | Chula Vista | 1976 | 12/17/2025 | 3 | 3 | 1,576 | 504,860 | $590,000 | $590,000 | $374 | 1.00 | 47 | 78 |
| 1434 Hilltop | Chula Vista | 1973 | 01/20/2026 | 3 | 2 | 1,296 | 0 | $499,000 | $491,000 | $379 | 0.98 | 52 | 77 |
| Total: 5 · Average | 3.2 | 2.8 | 1,534 | 389,563.25 | $582,800 | $582,800 | $381.2 | — | 48.4 | ||||
| Median | 1,576 | $590,000 | $590,000 | ||||||||||
Market Analysis
List vs Sale $/SqFt
Sale Price Trend
Days on Market
Sale vs List Price
This analysis was generated automatically from MLS data. For an in-depth, human-reviewed valuation, contact Joseph Sardella at josephsardella@gmail.com.