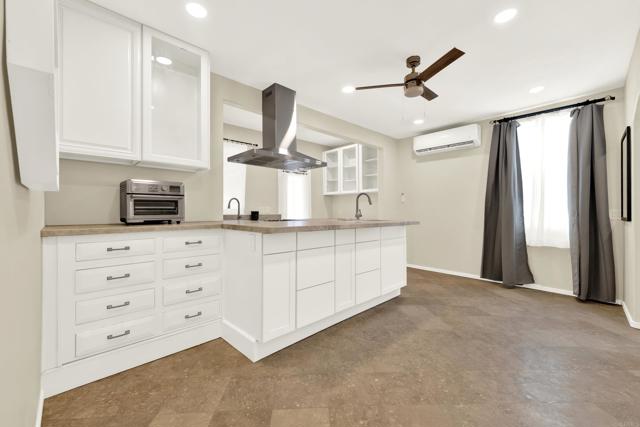
2971 Imperial Avenue, San Diego, CA 92102
2971 Imperial Avenue, San Diego, CA 92102
Property Description
Rare mixed-use investment opportunity on Imperial Ave!• Beautifully remodeled approx. 1,050 SF detached 3BR/2.5BA residence with higher-end finishes. • Separate approx. 700 SF commercial building fronting Imperial Ave. • Large newly built covered patio.• New gated driveway with alley access and parking for 6+ vehicles.• Excellent owner-user, live/work or income opportunity.• Significant long-term redevelopment potential.
Features & Amenities
Property Details
Mortgage Calculator
Current Rates
Comparative Market Analysis
Residential Tier · 5 active · 5 closed
San Diego · Single Family Residence
Listed 10.8% above the median closed sale of $975,000. Closed comps sold at 103% of list — strong seller's market.
Price Position
Positioned above the market — commands a premium.
Active Properties (5)
Active Comparables
| Address | City | Year | BD | BTH | SqFt | LotSz | LP/SqFt | LP | DIM | Score |
|---|---|---|---|---|---|---|---|---|---|---|
| 2834 L Street | San Diego | 1948 | 2 | 1 | 970 | 4,792 | $1,005 | $975,000 | 59 | 77 |
| 4162 Delta Street | San Diego | 2000 | 6 | 3 | 1,675 | 7,246 | $561 | $940,000 | 50 | 70 |
| 3964 Delta Street | San Diego | 1956 | 5 | 3 | 928 | 5,227 | $1,239 | $1.15M | 246 | 64 |
| 1738 33rd Street | San Diego | 1940 | 2 | 2 | 764 | 9,998 | $1,276 | $975,000 | 32 | 61 |
| 2536 Montclair | San Diego | 1937 | 2 | 1 | 855 | 8,150 | $1,403 | $1.20M | 79 | 57 |
| Total: 5 · Average | 3.4 | 2.0 | 1,038.4 | 7,082.6 | $1,096.8 | $1.05M | 93.2 | |||
| Median | 928 | $975,000 | ||||||||
Closed Properties (5)
Closed Comparables
| Address | City | Year | Date | BD | BTH | SqFt | LotSz | LP | SP | SP/SqFt | SP/LP | DIM | Score |
|---|---|---|---|---|---|---|---|---|---|---|---|---|---|
| 2959 B Street | San Diego | 2021 | 07/06/2026 | 3 | 2 | 1,080 | 5,335 | $860,000 | $920,000 | $852 | 1.07 | 45 | 78 |
| 1904 Gateway Drive | San Diego | 1956 | 10/28/2026 | 4 | 2 | 1,740 | 6,398 | $849,900 | $975,000 | $560 | 1.15 | 36 | 74 |
| 1020 41st St. | San Diego | 1939 | 05/08/2026 | 5 | 3 | 1,606 | 2,800 | $999,000 | $999,000 | $622 | 1.00 | 265 | 70 |
| 431 Cuyamaca Avenue | San Diego | 1970 | 11/13/2025 | 6 | 4 | 2,716 | 6,247 | $979,999 | $979,999 | $361 | 1.00 | 116 | 57 |
| 1804 Colonial Avenue | San Diego | 1958 | 12/08/2025 | 4 | 2 | 1,432 | 6,400 | $999,000 | $945,000 | $660 | 0.95 | 98 | 57 |
| Total: 5 · Average | 4.4 | 2.6 | 1,714.8 | 5,436 | $963,799.8 | $963,799.8 | $611 | — | 112 | ||||
| Median | 1,606 | $975,000 | $975,000 | ||||||||||
Market Analysis
List vs Sale $/SqFt
Sale Price Trend
Days on Market
Sale vs List Price
This analysis was generated automatically from MLS data. For an in-depth, human-reviewed valuation, contact Joseph Sardella at josephsardella@gmail.com.