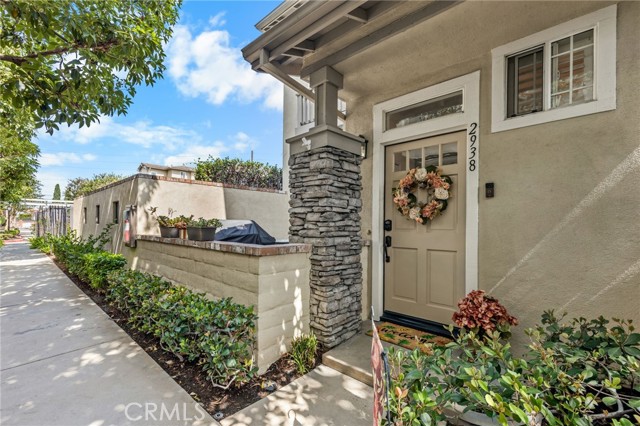
2938 Claremore Lane, Los Alamitos, CA 90720
2938 Claremore Lane, Los Alamitos, CA 90720
Property Description
"Motivated Seller! Beautiful, Move-In Ready End Unit, Bring Your Buyers" Welcome to the Bungalows, a desirable gated community. This turnkey end-unit home features three bedrooms, three bathrooms abundant natural light and an attached two-car garage. Enjoy a comfortable, move-in-ready interior in a prime location, along with community amenities that include a sparkling pool, relaxing spa and two convenient dog parks. Located within the highly regarded Los Alamitos Unified School District and close to shopping, dining and major freeways - don't miss this wonderful opportunity.
Features & Amenities
Property Details
Mortgage Calculator
Current Rates
Comparative Market Analysis
Affordable Tier · 2 active · 5 closed
Los Alamitos · Condominium
Listed 10.3% above the median closed sale of $815,000. Price per sqft ($741) is a 36% premium to closed comps ($546).
Price Position
Positioned above the market — commands a premium.
Active Properties (2)
Active Comparables
| Address | City | Year | BD | BTH | SqFt | LotSz | LP/SqFt | LP | DIM | Score |
|---|---|---|---|---|---|---|---|---|---|---|
| 2925 Claremore Lane | Long Beach | 1995 | 2 | 3 | 1,275 | 21,438 | $624 | $795,500 | 2 | 88 |
| 5406 Villa Way | Cypress | 1974 | 3 | 3 | 1,374 | 111,381 | $567 | $779,000 | 107 | 61 |
| Total: 2 · Average | 2.5 | 3.0 | 1,324.5 | 66,409.5 | $595.5 | $787,250 | 54.5 | |||
| Median | 1,374 | $795,500 | ||||||||
Closed Properties (5)
Closed Comparables
| Address | City | Year | Date | BD | BTH | SqFt | LotSz | LP | SP | SP/SqFt | SP/LP | DIM | Score |
|---|---|---|---|---|---|---|---|---|---|---|---|---|---|
| 2912 Claremore Lane | Los Alamitos | 1997 | 12/08/2025 | 3 | 3 | 1,400 | 0 | $829,000 | $815,000 | $582 | 0.98 | 67 | 85 |
| 12300 Montecito Road | Seal Beach | 1972 | 06/11/2026 | 3 | 2 | 1,615 | 67,419 | $834,000 | $800,000 | $495 | 0.96 | 56 | 63 |
| 12300 Montecito Road | Seal Beach | 1972 | 09/03/2026 | 3 | 2 | 1,615 | 0 | $769,000 | $775,000 | $480 | 1.01 | 68 | 62 |
| 8692 Belmont | Cypress | 2012 | 07/16/2026 | 3 | 2 | 1,386 | 35,147 | $835,000 | $835,000 | $602 | 1.00 | 44 | 62 |
| 8643 Belmont | Cypress | 2006 | 04/29/2026 | 3 | 3 | 1,564 | 19,697 | $899,000 | $895,000 | $572 | 1.00 | 13 | 60 |
| Total: 5 · Average | 3.0 | 2.4 | 1,516 | 40,754.333 | $824,000 | $824,000 | $546.2 | — | 49.6 | ||||
| Median | 1,564 | $815,000 | $815,000 | ||||||||||
Market Analysis
List vs Sale $/SqFt
Sale Price Trend
Days on Market
Sale vs List Price
This analysis was generated automatically from MLS data. For an in-depth, human-reviewed valuation, contact Joseph Sardella at josephsardella@gmail.com.