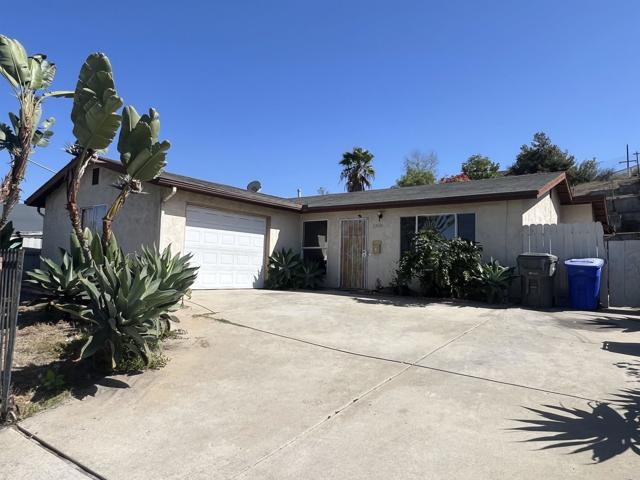
2930 E Plaza Blvd., National City, CA 91950
2930 E Plaza Blvd., National City, CA 91950
Property Description
Fixer. Be the first to take advantage of this opportunity to Fix and Save. This investment opportunity is ideal for someone who wants to transform a house into their ideal home or investment. Great location for shopping, local dining, and access to a major freeway for an effortless commute. Nestled in a very established neighborhood and convenient proximity to schools. Low maintenance terraced backyard. Perfect which can be good for gardening.
Features & Amenities
Property Details
Mortgage Calculator
Current Rates
Comparative Market Analysis
Affordable Tier · 5 active · 5 closed
National City · Single Family Residence
Listed 5.5% below the median closed sale of $550,000. Price per sqft ($436) is a 15% discount to closed comps ($511).
Price Position
Priced below the market — value advantage over the field.
Active Properties (5)
Active Comparables
| Address | City | Year | BD | BTH | SqFt | LotSz | LP/SqFt | LP | DIM | Score |
|---|---|---|---|---|---|---|---|---|---|---|
| 5282 Naranja Street | San Diego | 2025 | 3 | 3 | 1,423 | 900 | $379 | $539,000 | 92 | 63 |
| 19 Balsam | National City | 1930 | 2 | 1 | 859 | 2,613 | $681 | $584,900 | 17 | 62 |
| 4958 Ocean View Boulevard | San Diego | 2026 | 3 | 3 | 1,479 | 904 | $391 | $579,000 | 271 | 62 |
| 5282 Naranja Street | San Diego | 2025 | 3 | 3 | 1,423 | 900 | $379 | $539,000 | 162 | 62 |
| 130 7Th Street | National City | 1945 | 2 | 1 | 783 | 1,686 | $734 | $574,999 | 68 | 58 |
| Total: 5 · Average | 2.6 | 2.2 | 1,193.4 | 1,400.6 | $512.8 | $563,379.8 | 122 | |||
| Median | 1,423 | $574,999 | ||||||||
Closed Properties (5)
Closed Comparables
| Address | City | Year | Date | BD | BTH | SqFt | LotSz | LP | SP | SP/SqFt | SP/LP | DIM | Score |
|---|---|---|---|---|---|---|---|---|---|---|---|---|---|
| 1810 Granger Avenue | National City | 1950 | 08/26/2026 | 2 | 1 | 1,032 | 5,663 | $705,000 | $535,000 | $518 | 0.76 | 20 | 77 |
| 4021 Cherry Blossom Street | National City | 1959 | 11/26/2025 | 3 | 2 | 1,152 | 6,100 | $619,900 | $550,000 | $477 | 0.89 | 47 | 77 |
| 1322 49th Street | San Diego | 1958 | 02/18/2026 | 3 | 2 | 1,050 | 5,300 | $480,000 | $571,000 | $544 | 1.19 | 22 | 72 |
| 5859 Skyline Drive | San Diego | 1956 | 01/16/2026 | 3 | 2 | 1,134 | 6,500 | $625,000 | $550,000 | $485 | 0.88 | 74 | 71 |
| 3012 Alta Drive | National City | 1926 | 10/22/2026 | 2 | 2 | 946 | 10,019 | $480,000 | $500,000 | $529 | 1.04 | 23 | 70 |
| Total: 5 · Average | 2.6 | 1.8 | 1,062.8 | 6,716.4 | $541,200 | $541,200 | $510.6 | — | 37.2 | ||||
| Median | 1,050 | $550,000 | $550,000 | ||||||||||
Market Analysis
List vs Sale $/SqFt
Sale Price Trend
Days on Market
Sale vs List Price
This analysis was generated automatically from MLS data. For an in-depth, human-reviewed valuation, contact Joseph Sardella at josephsardella@gmail.com.